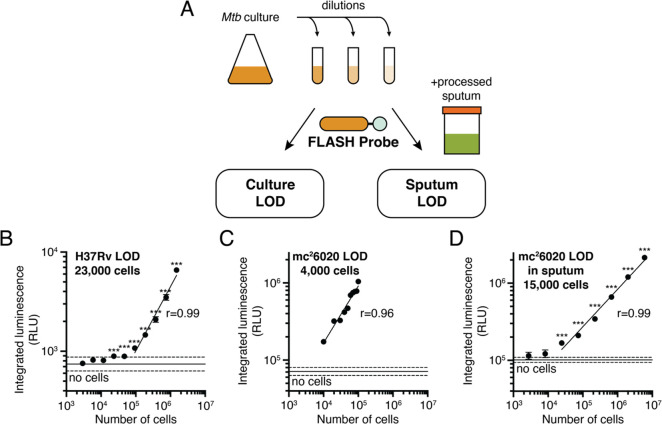
Figure 3.
FLASH is a quantitative probe for Mtb cells. (A) To determine the limit of detection, cultures of Mtb were serially diluted into medium or into processed human sputum and then incubated with the FLASH probe. Total integrated luminescence after 1 h of incubation of the FLASH probe with (B) Mtb H37Rv in 7H9 medium, (C) mc26020 in 7H9 medium, and (D) mc26020 in processed human sputum (mean ± SD, n = 3). Horizontal lines show the mean (solid) ± 3 SD (dashed) of control samples lacking cells. For all experiments, each sample was compared to the no-bacteria control via one-way ANOVA with Dunnett’s test (***, p < 0.001; for part C, all comparisons yielded p < 0.001). Best fit lines show linear regressions to the log-transformed data (excluding cell concentrations that are not significantly different from the control). Limits of detection were calculated by determining the cell number for which the best fit line intercepts the mean + 3 SD of the control samples.

