Figure 5.
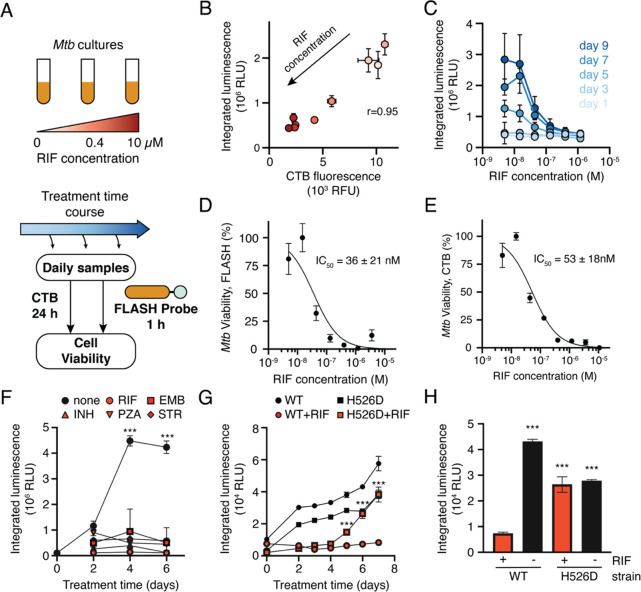
FLASH provides a quantitative measure of Mtb viability. (A) Mtb cultures were treated with RIF for up to 9 days. Samples were removed throughout the treatment period and incubated with FLASH for 1 h, or with CellTiter-Blue (CTB) for 24 h. (B) FLASH and CTB measurements for cultures treated for 7 days with RIF (mean ± SD, n = 3). Marker colors correspond to RIF concentrations shown in part A. (C) FLASH signal dependence on RIF concentration for each day (mean ± SD, n = 3). Dose response for killing by RIF as measured by the FLASH probe (D) or CTB (E) (mean ± SD, n = 3). Data were normalized to DMSO (100% viability) and 10 μM RIF (0% viability) and fitted to a two-parameter logistic function. IC50 values are reported as 95% confidence intervals. (F) Time course of mc26020 treated with the critical concentrations of rifampicin (RIF, 1 μg/mL), ethambutol (EMB, 5 μg/mL), isoniazid (INH, 0.1 μg/mL), pyrazinamide (PZA, 100 μg/mL), or streptomycin (STR, 1 μg/mL). For all days, the signal from untreated cultures was compared to each of the treated cultures via a two-way ANOVA with Dunnett’s test (n = 3; ***, p < 0.001 for the comparison between untreated cultures and each of the antibiotic conditions). (G) Time course of H37Rv (WT) Mtb and RpoB H526D mutant Mtb (H526D) treated with DMSO (black) or the critical concentration of RIF (red). For each day, the RIF- and DMSO-treated conditions were compared via an independent t test (n = 3; ***, p < 0.001). (H) Luminescent signal from H37Rv (WT) or H526D after 6 days of culture in the presence or absence of RIF. Samples are compared to the WT Mtb strain treated with RIF via one-way ANOVA with Dunnett’s test (n = 3; ***, p < 0.001).

