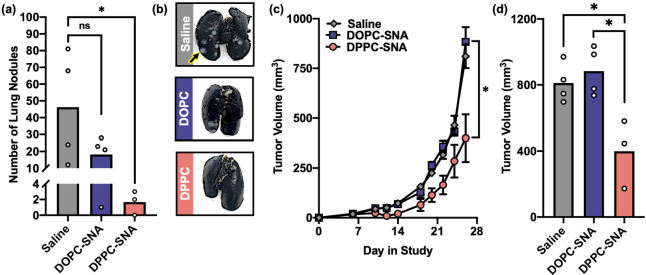
Figure 4.
In vivo antimetastic and antitumor activity of L-SNAs in the 4T1 TNBC model. (a) Lung metastasis production, as measured by the number of lung nodules identified at day 28 in the study, following administration of saline (gray bar), DOPC-SNAs (blue bar), or DPPC-SNAs (pink bar). White dots represent individual animals in each group. (b) Representative photos of lungs excised from each group. (c) Primary tumor growth in the 4T1 model following administration of saline (gray diamonds), DOPC-SNAs (blue square), or DPPC-SNAs (pink circle). Error bars represent standard errors of the mean. (d) Comparison of tumor volume between treatment groups at day 28 in the study. White dots represent individual animals in each group. Statistical analysis was performed using an unpaired t test, where “*” represents a p value of <0.05, and “ns” represents a p value of >0.05.

