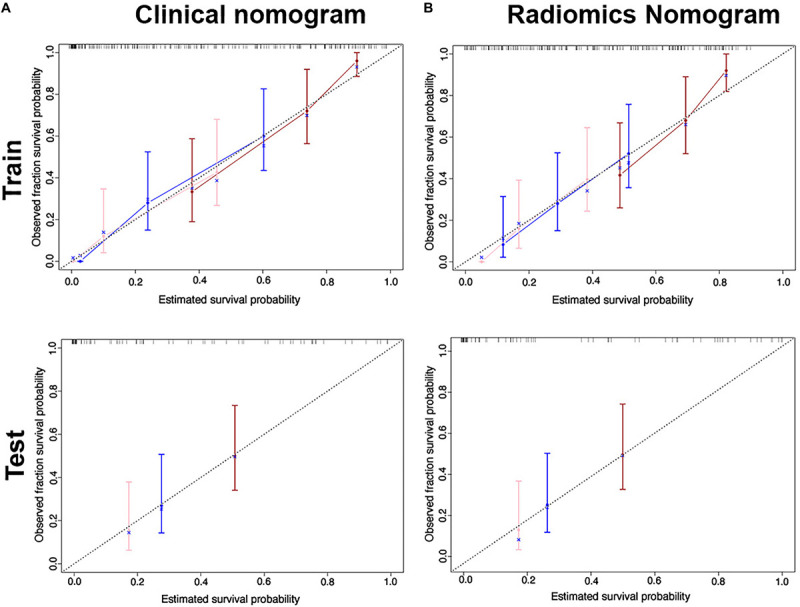
FIGURE 5.

Calibration curves for the clinical nomogram (A) and radiomics nomogram (B) show the calibration of each model in terms of the agreement between the estimated and observed 1-, 2- and 3-year outcomes for the training cohort (first row) and the test cohort (second row).
