
FIGURE 2.
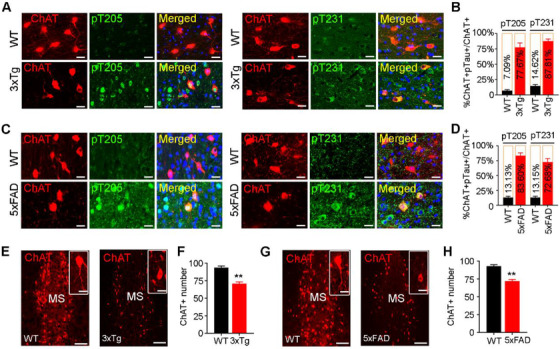
Accumulation of phosphorylated tau correlates with cholinergic neuron loss in MS of 3xTg and 5xFAD mice. (A–D) MS cholinergic neuron accumulation of phospho‐tau in 3xTg (A, B) and 5xFAD (C, D) mice detected by co‐immunofluorescence staining of pTau with ChAT and presented by the ratio of ChAT+ and pTau+ neuron number to ChAT+ neuron number. n = 3 Mice per group; scale bar, 20 μm. (E–H) Cholinergic neuron loss in MS of 3xTg (E, F) and 5xFAD (G, H) mice measured by ChAT counting. n = 3 Mice per group; scale bar, 100 μm or 20 μm for inset. Unpaired t‐test, t = 6.753 df = 16, p < .01 (F) or t = 6.843 df = 16, p < .01 (H). **p < .01 versus WT group. Data are presented as mean ± SEM