
Figure 3 .
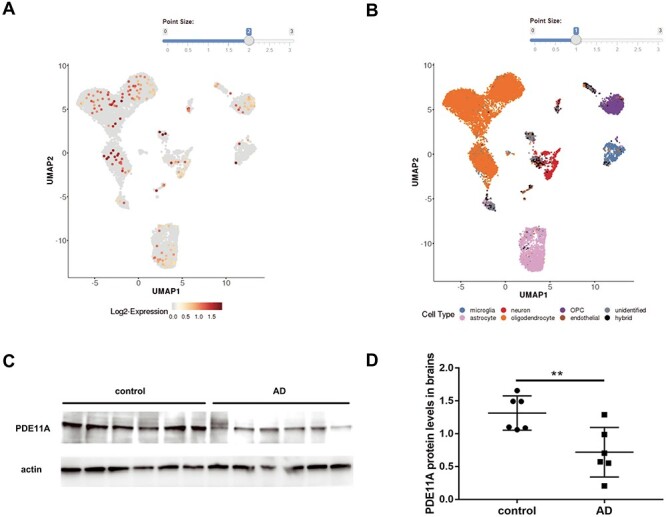
The PDE11A expression in brain tissues of AD. (A and B) Based on single-nucleus RNA sequencing data, PDE11A gene was expressed almost in all kinds of cells. (C) Representative western blots illustrate the expression of PDE11A in postmortem brain tissues. (D) The histogram shows the quantification of PDE11A detected by immunoblot relative to control levels. The data are represented as the mean ± SEM, based on three unrelated measurements. **P < 0.01 by Student’s t-test.