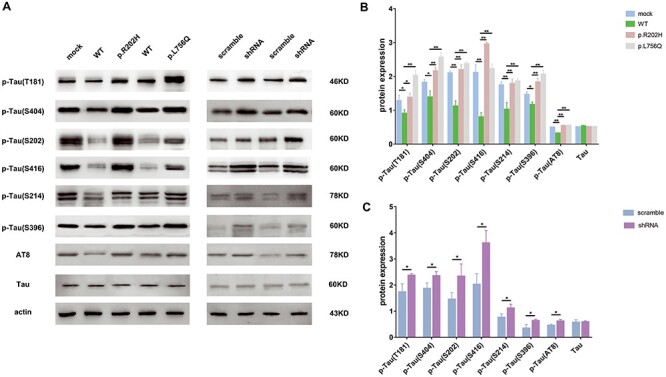
Figure 4 .

The PDE11A variants led to significantly high Tau phosphorylation levels. The cells were co-infected with MAPT and PDE11A lentivirus (PDE11A WT, mutants, scramble or shRNA). A total of 72 h after infection, cell lysates were used to detect levels of p-Tau(T181), p-Tau(S404), p-Tau(S202), p-Tau(S416), p-Tau(S214), p-Tau(S396), p-Tau(AT8) and Tau. (A) Representative western blots illustrate the expressions of phosphorylated Tau. (B and C) The histograms show the quantification of phosphorylated Tau levels detected by immunoblot relative to control levels. The data are represented as the mean ± SEM, based on three unrelated measurements. *P < 0.05, **P < 0.01 by one-way ANOVA and Dunnett test or Student’s t-test.
