. 2020 Jul 29;11(32):8416–8424. doi: 10.1039/d0sc02891f

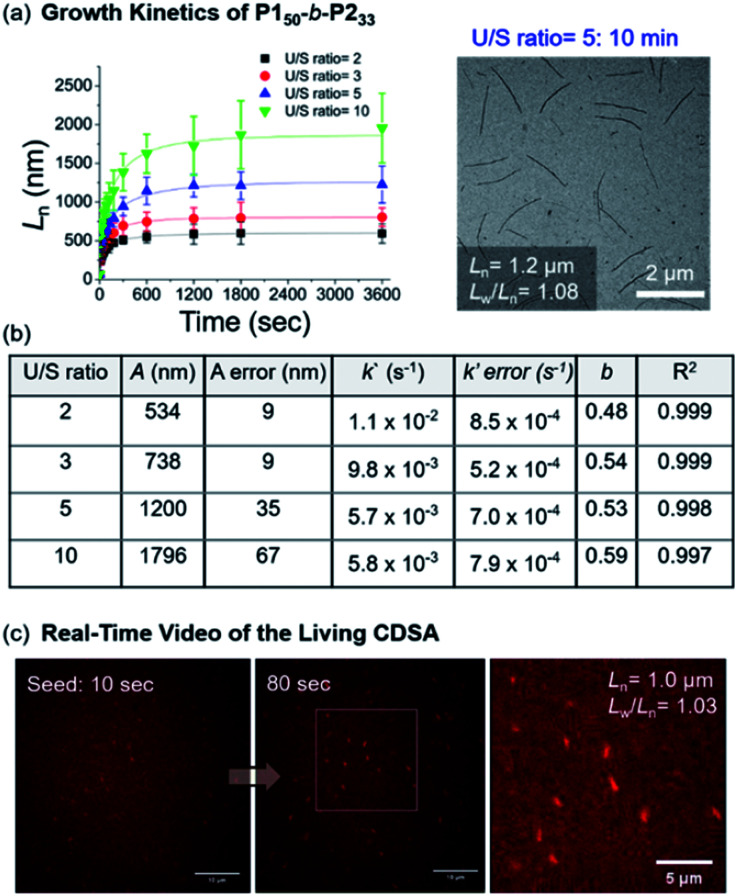
Fig. 8. (a) Lengths (Ln) of the 1D nanofibers from P150-b-P233 over time (monitored over 13 h after adding the unimer solution to the seed micelles (Ln = 66.5 nm, Lw/Ln = 1.16)). TEM image was obtained after 10 min with U/S ratio = 5. (b) Table of kinetic data for various U/S ratios. Standard errors for the values A, k′, and b were obtained from the fitting of eqn (S1).A is the actual length growth obtained by LnLseed (seed length). k′ is the rate constant. b is the fractional power of the exponential. (c) Representative LSCM images of Video S1 at time points of 10 and 80 s (scale bars = 10 μm). We calculated the Ln of the 1D nanofibers from those images.

Fig. 8