. 2020 Jul 27;11(32):8506–8516. doi: 10.1039/d0sc02837a

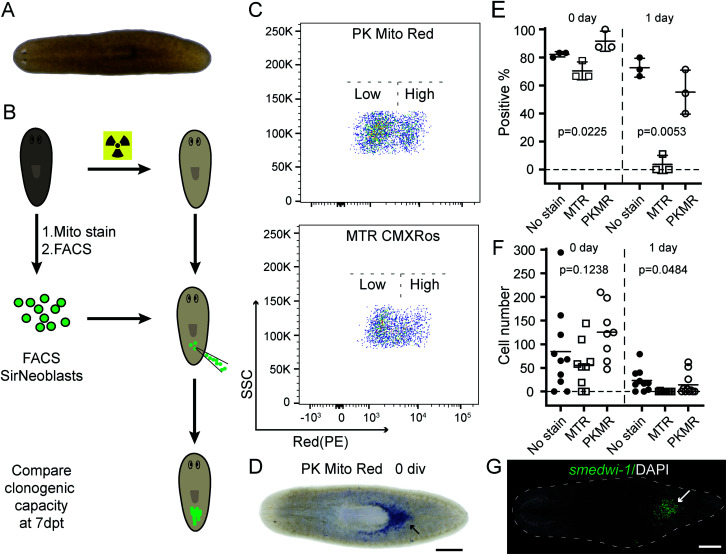
Fig. 5. PK Mito Red causes minimal damage during sorting and transplantation of planarian stem cells. (A) Image of a live planarian. (B) Cartoon showing the experimental design of the transplantation assay. (C) FACS plots showing the mitochondria signal intensities of SirNeoblasts after staining with PK Mito Red (upper) and MTR CMXRos (lower), respectively. (D) Representative image showing the clonogenicity of PK Mito Red-stained SirNeoblasts. Transplantation with freshly isolated cells is indicated as 0 div. Blue staining indicates neoblasts generated from transplanted cells (head leftwards). Scale bar: 500 μm. (E) Dot plot of the percentage of planarian hosts 7 days post-transplantation containing smedwi-1+ neoblasts generated from cells stained with the indicated dyes. Transplantation with 1 day cultured cells is indicated as 1 day. N > 8 in each replicate experiment. (F) Dot plot of the smedwi-1+ cell number in each planarian host (N > 8). P values were calculated using one-way ANOVA. (G) Fluorescence image showing the smedwi-1+ neoblasts (green and indicated by an arrow) generated from PK Mito Red-stained SirNeoblasts in a transplant host 7 days post-transplantation. Scale bar: 500 μm.

Fig. 5