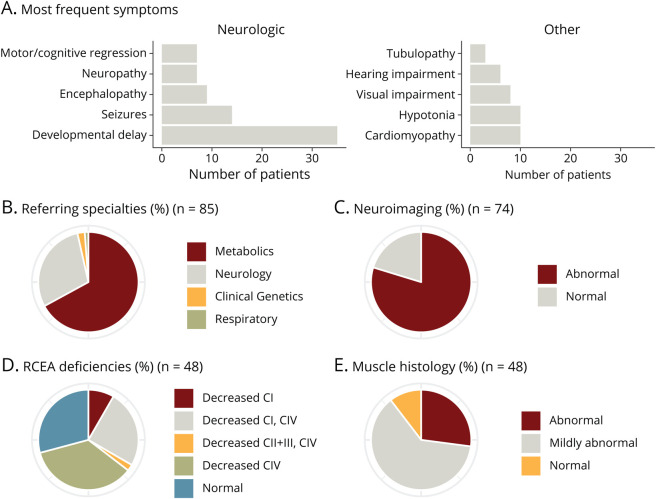
Figure 1. Patient Cohort Characterization.
(A) Bar chart depicting number of patients in whom a specific symptom was found. (B) Referral of patients for clinical exome sequencing per medical specialty. (C) Pie chart depicting proportions of general neuroimaging outcomes. (D) Summary of the outcome of respiratory chain enzyme activity (RCEA) measurements in muscle biopsy. (E) General muscle (light and electron) histology results. For all pie charts, n values indicate in how many patients the investigation was performed.

