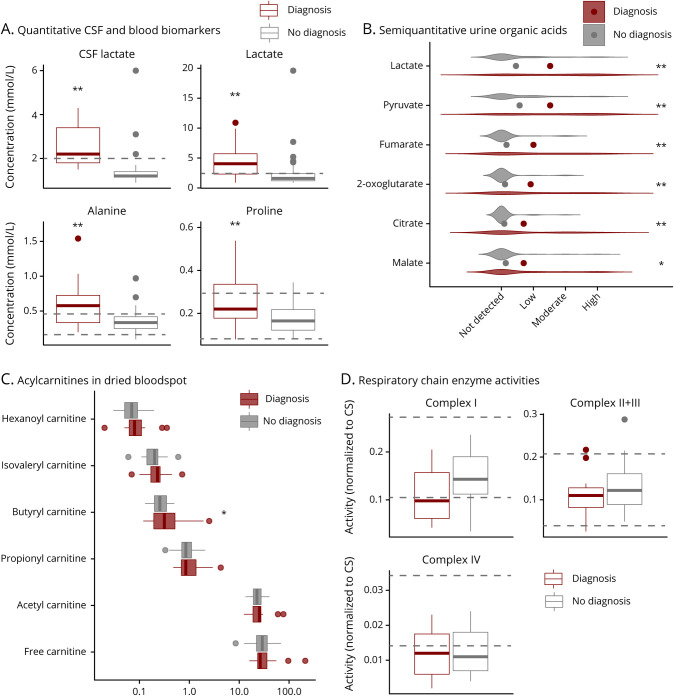
Figure 2. Biochemical Characterization.
(A) Boxplots of CSF and plasma biomarkers. Dashed horizontal lines indicate reference ranges; for CSF lactate and plasma lactate, normal values are below the dashed horizontal line. (B) Violin plots illustrating results of semiquantitative urine organic acid measurements, points represent mean values. (C) Horizontal boxplots of acylcarnitine results. Boxplots consist of horizontal marks for the 25th percentile, the median, and the 75th percentile, whiskers extend to the 5th and 95th percentile, and outliers are represented as separate individual values. (D) Boxplot of levels of respiratory chain enzyme activities normalized to citrate synthase (CS) activity. Dashed horizontal lines indicate reference ranges. All plots are split in 2 groups of patients with a mitochondrial diagnosis in red and those with no mitochondrial diagnosis in gray. Significance of differences was determined by logistic regression analysis. * = p ≤ 0.05; ** = p ≤ 0.01.

