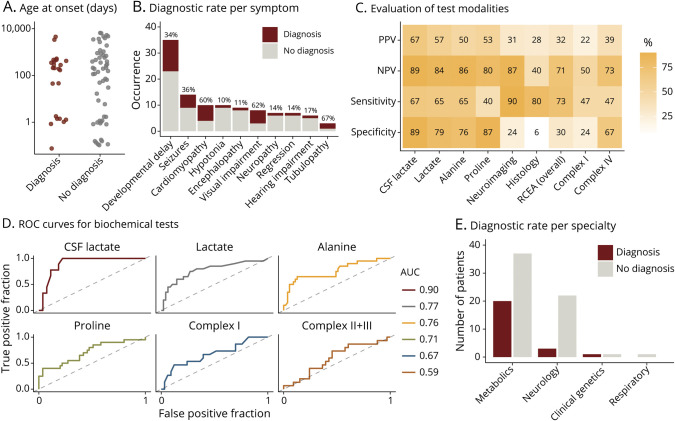
Figure 3. Predictive Parameters for Mitochondrial Disease.
The panels in this figure describe comparisons between patients with a mitochondrial diagnosis (red) and patients with no diagnosis (including nonmitochondrial diagnosis, gray). (A) Age at presentation of individual patients; for better visibility on the log scale (y-axis), patients with antenatal abnormalities were assigned an age at onset of 0.1 day and for onset at birth of 1 day. (B) Bar chart illustrating the occurrence of the most frequent symptoms in the cohort, including diagnostic rate in percent for each individual symptom above the bars, as calculated by number of patients with this symptom and a mitochondrial diagnosis divided by the number of all patients with this symptom. (C) Heatmap depicting levels of positive predictive value (PPV), negative predicate value (NPV), sensitivity, and specificity for different test modalities, calculated using a genetic mitochondrial diagnosis as the gold standard. In the calculations, a positive outcome of test modalities was considered as follows: raised levels of lactate, alanine, and proline, decreased activity of RCEA complexes, and abnormal neuroimaging, RCEA, or histology. (D) ROC curves for selected continuous test variables. (E) Bar graph depicting the outcome of clinical exome analysis per referring specialty. AUC = area under the ROC curve; RCEA = respiratory chain enzyme activity; ROC = receiver operating characteristic.

