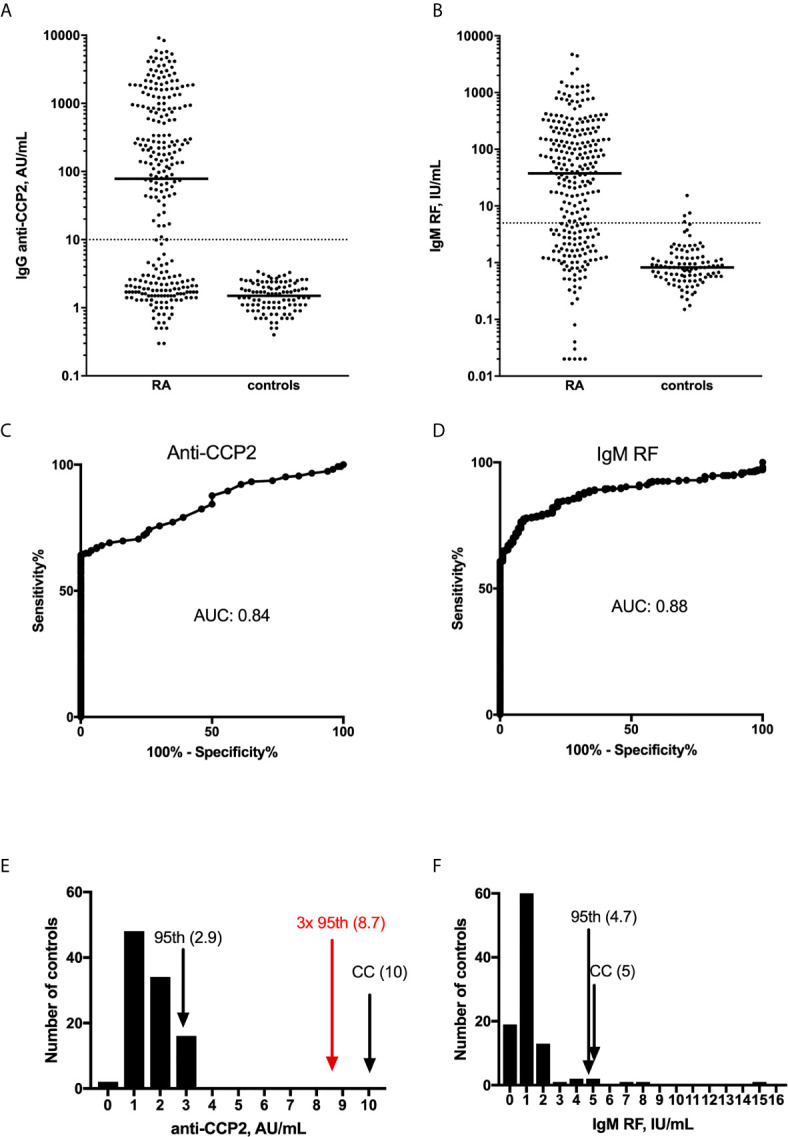
Figure 2.

Distribution of (A, C, E) anti-CCP2 and (B, D, F) IgM RF among 268 RA patients and 100 healthy blood donors from Sweden. In (A, C). dot blots are shown with the medians depicted as horizontal solid lines. The dotted horizontal lines depict the cut-off points for clearly positive responses, as suggested by the manufacturer. In (B, D), the corresponding Receiver Operator Characteristics (ROC) curves are shown; including information about Area Under the Curve (AUC). In (E, F) the distribution of the 100 controls is depicted for anti-CCP2 and IgM RF, with vertical arrows depicting the 95th percentile among the 100 controls (95th), the company-suggested cutoffs (CC), and in (E) the value three times higher than the 95th percentile (3x 95th, in red). Figures within parentheses show the corresponding measurement values.
