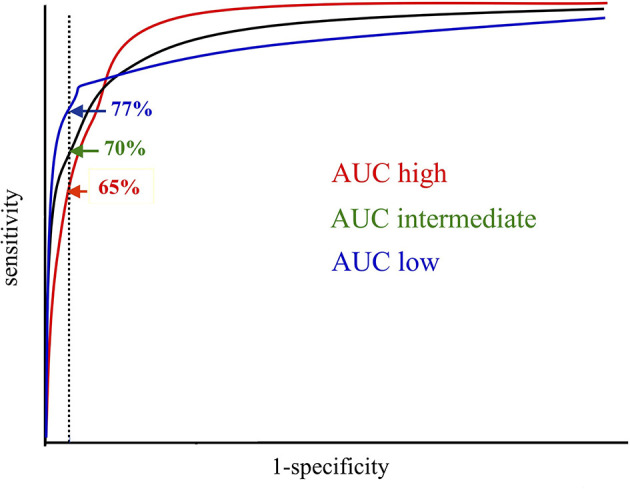
Figure 3.

When diagnostic sensitivities are compared between different tests, they should be aligned to the same diagnostic specificity, preferably in the high specificity range. In this schematic figure, the Area Under the Curve (AUC) is highest for the red and lowest for the blue Receiver Operator Characteristics (ROC) curve. However, at the predefined diagnostic specificity (vertical dotted line) the blue ROC curve represents the test with the highest sensitivity, which should be preferred when laboratory results are reported in relation to one single cutoff. The original picture was obtained from Allan Wiik, Copenhagen, and published in modified form with his permission.
