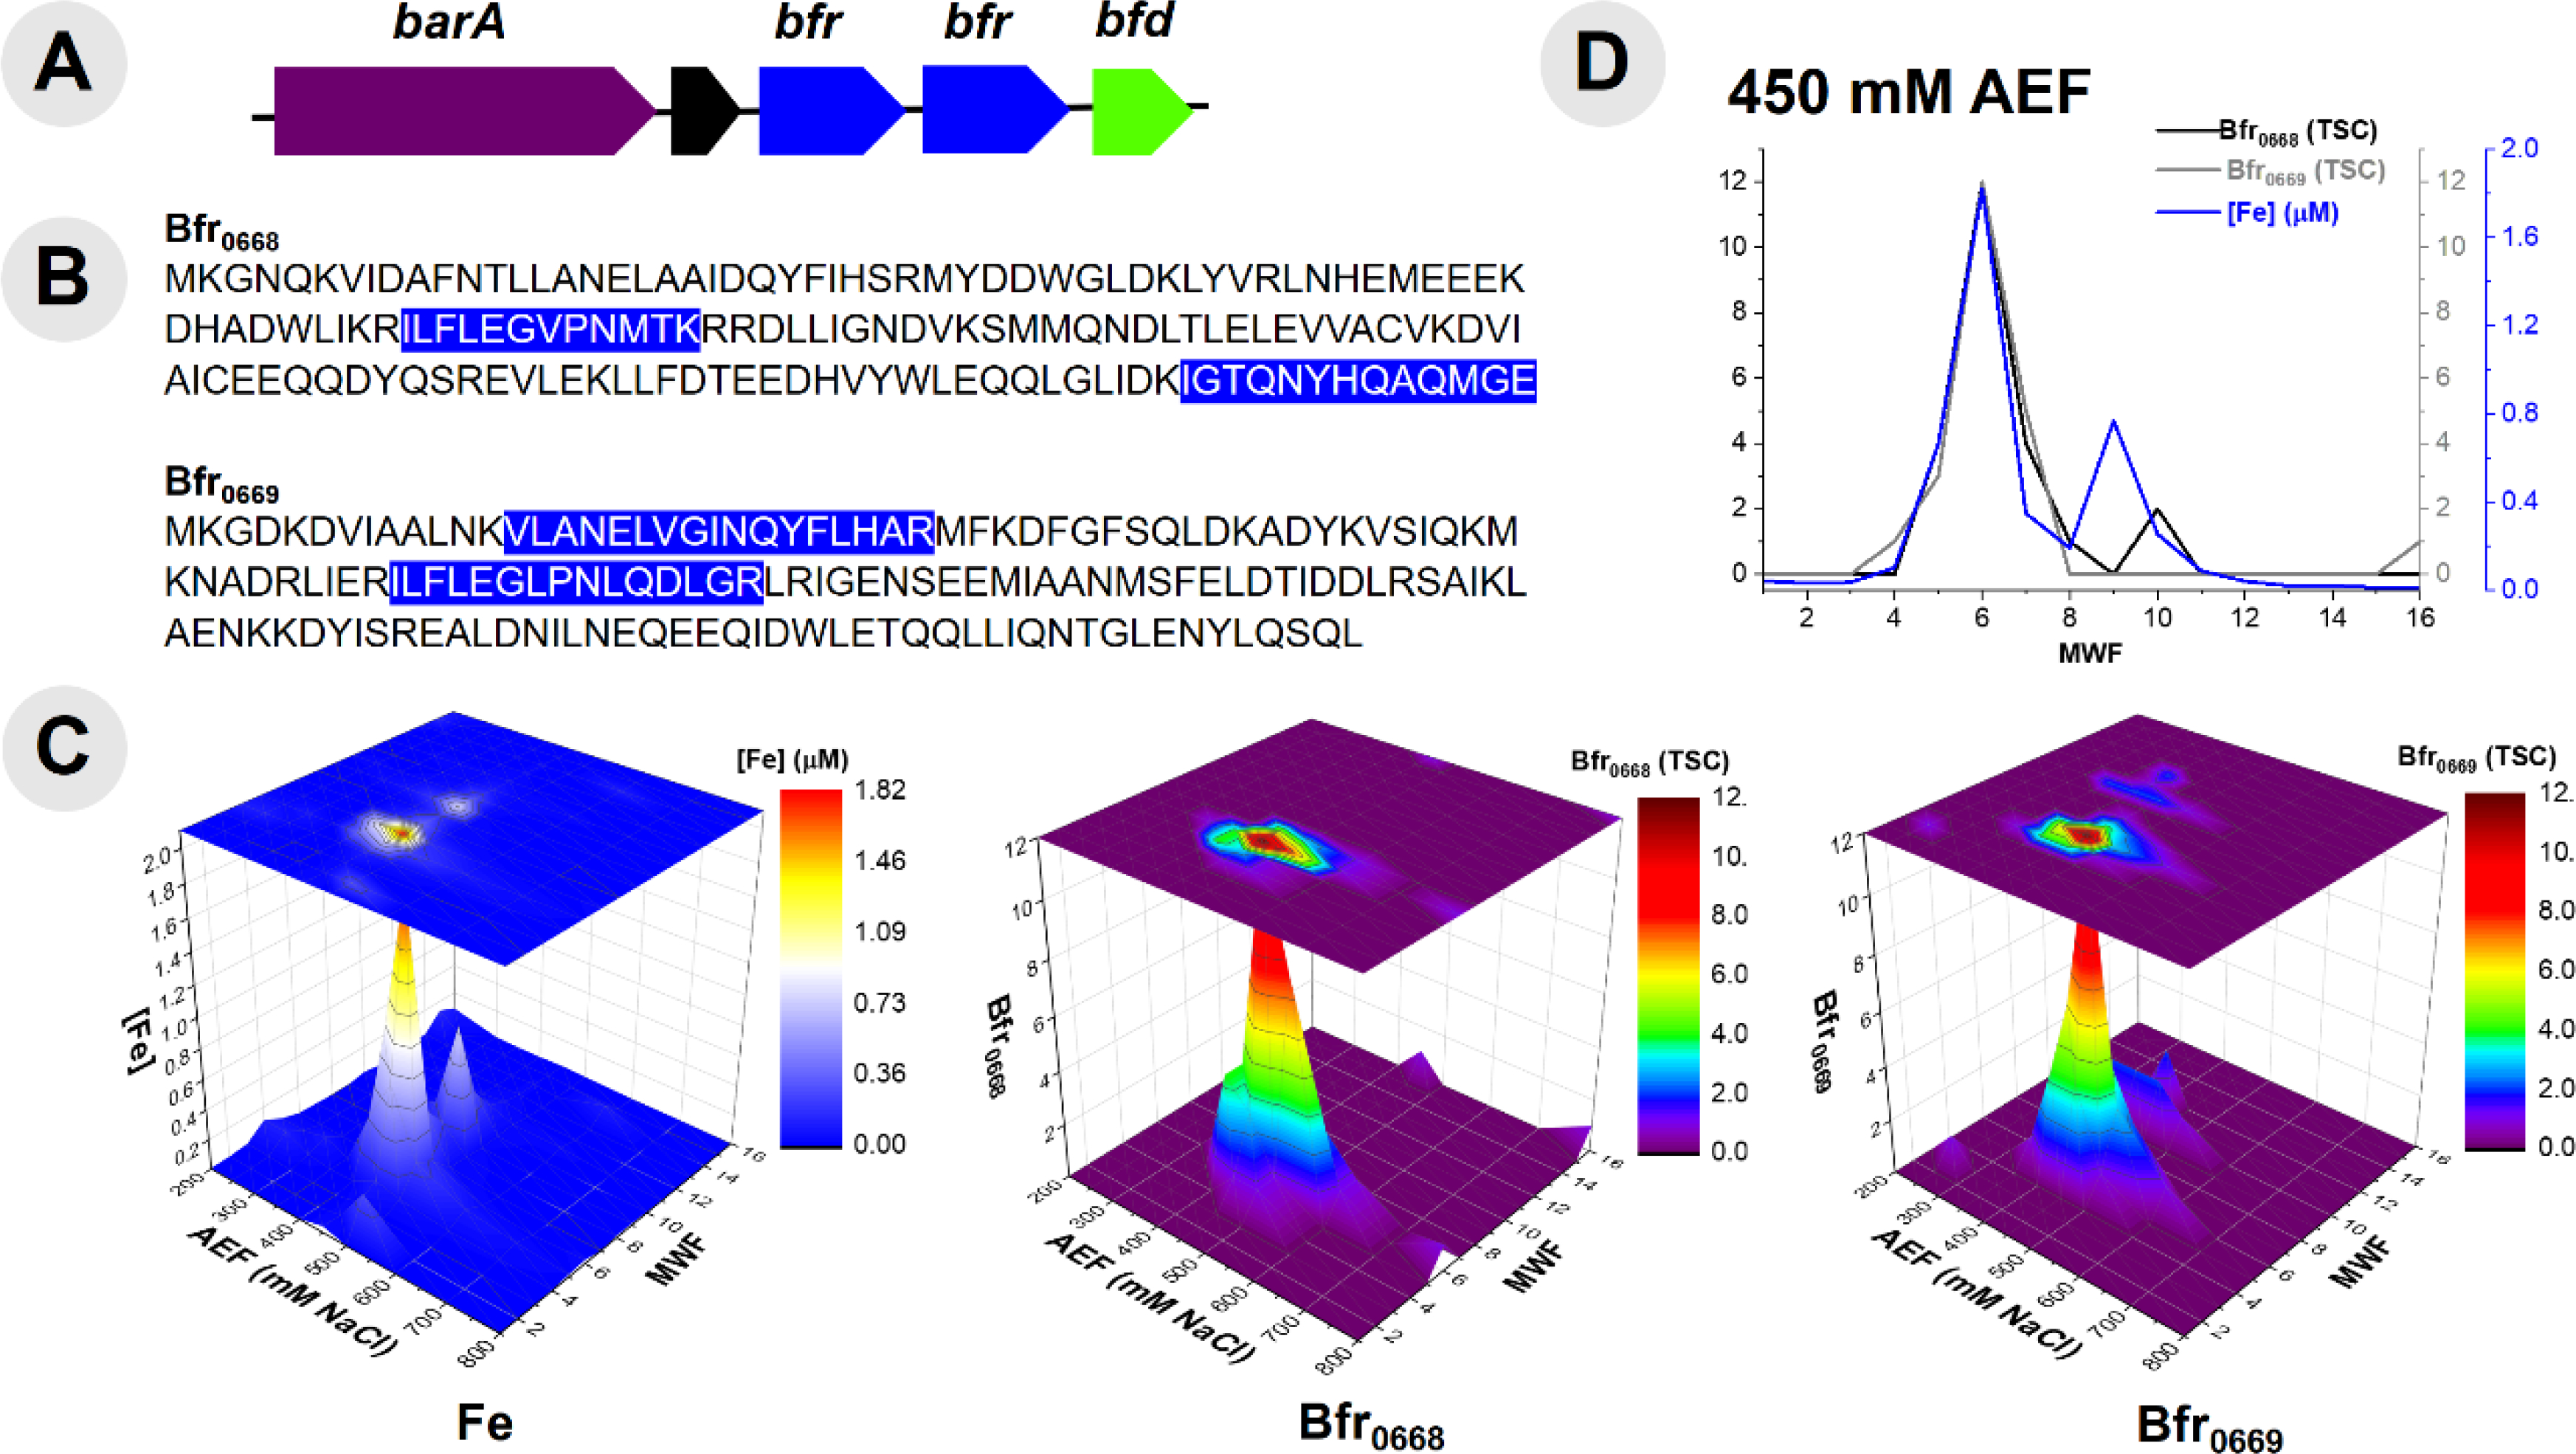
Fig 3.

(A) Gene neighborhood diagram indicating two unique bacterioferritin (Bfr) proteins and their respective sequences (B) with highlighted portions indicating unique tryptic peptides that were observed in proteomic analysis of Bfr proteins. (C) Comparison of distribution of Fe within the purified cytosolic lysate of BB2-AT2 to that of two distinct Bfr proteins observed by proteomic analysis. (D) Comparison (with selection of exclusively the 450 mM anion exchange fraction, where these proteins were observed in highest abundance) with that of the distribution of Fe in the cytosol provides confidence of the Fe-containing nature of these proteins.
