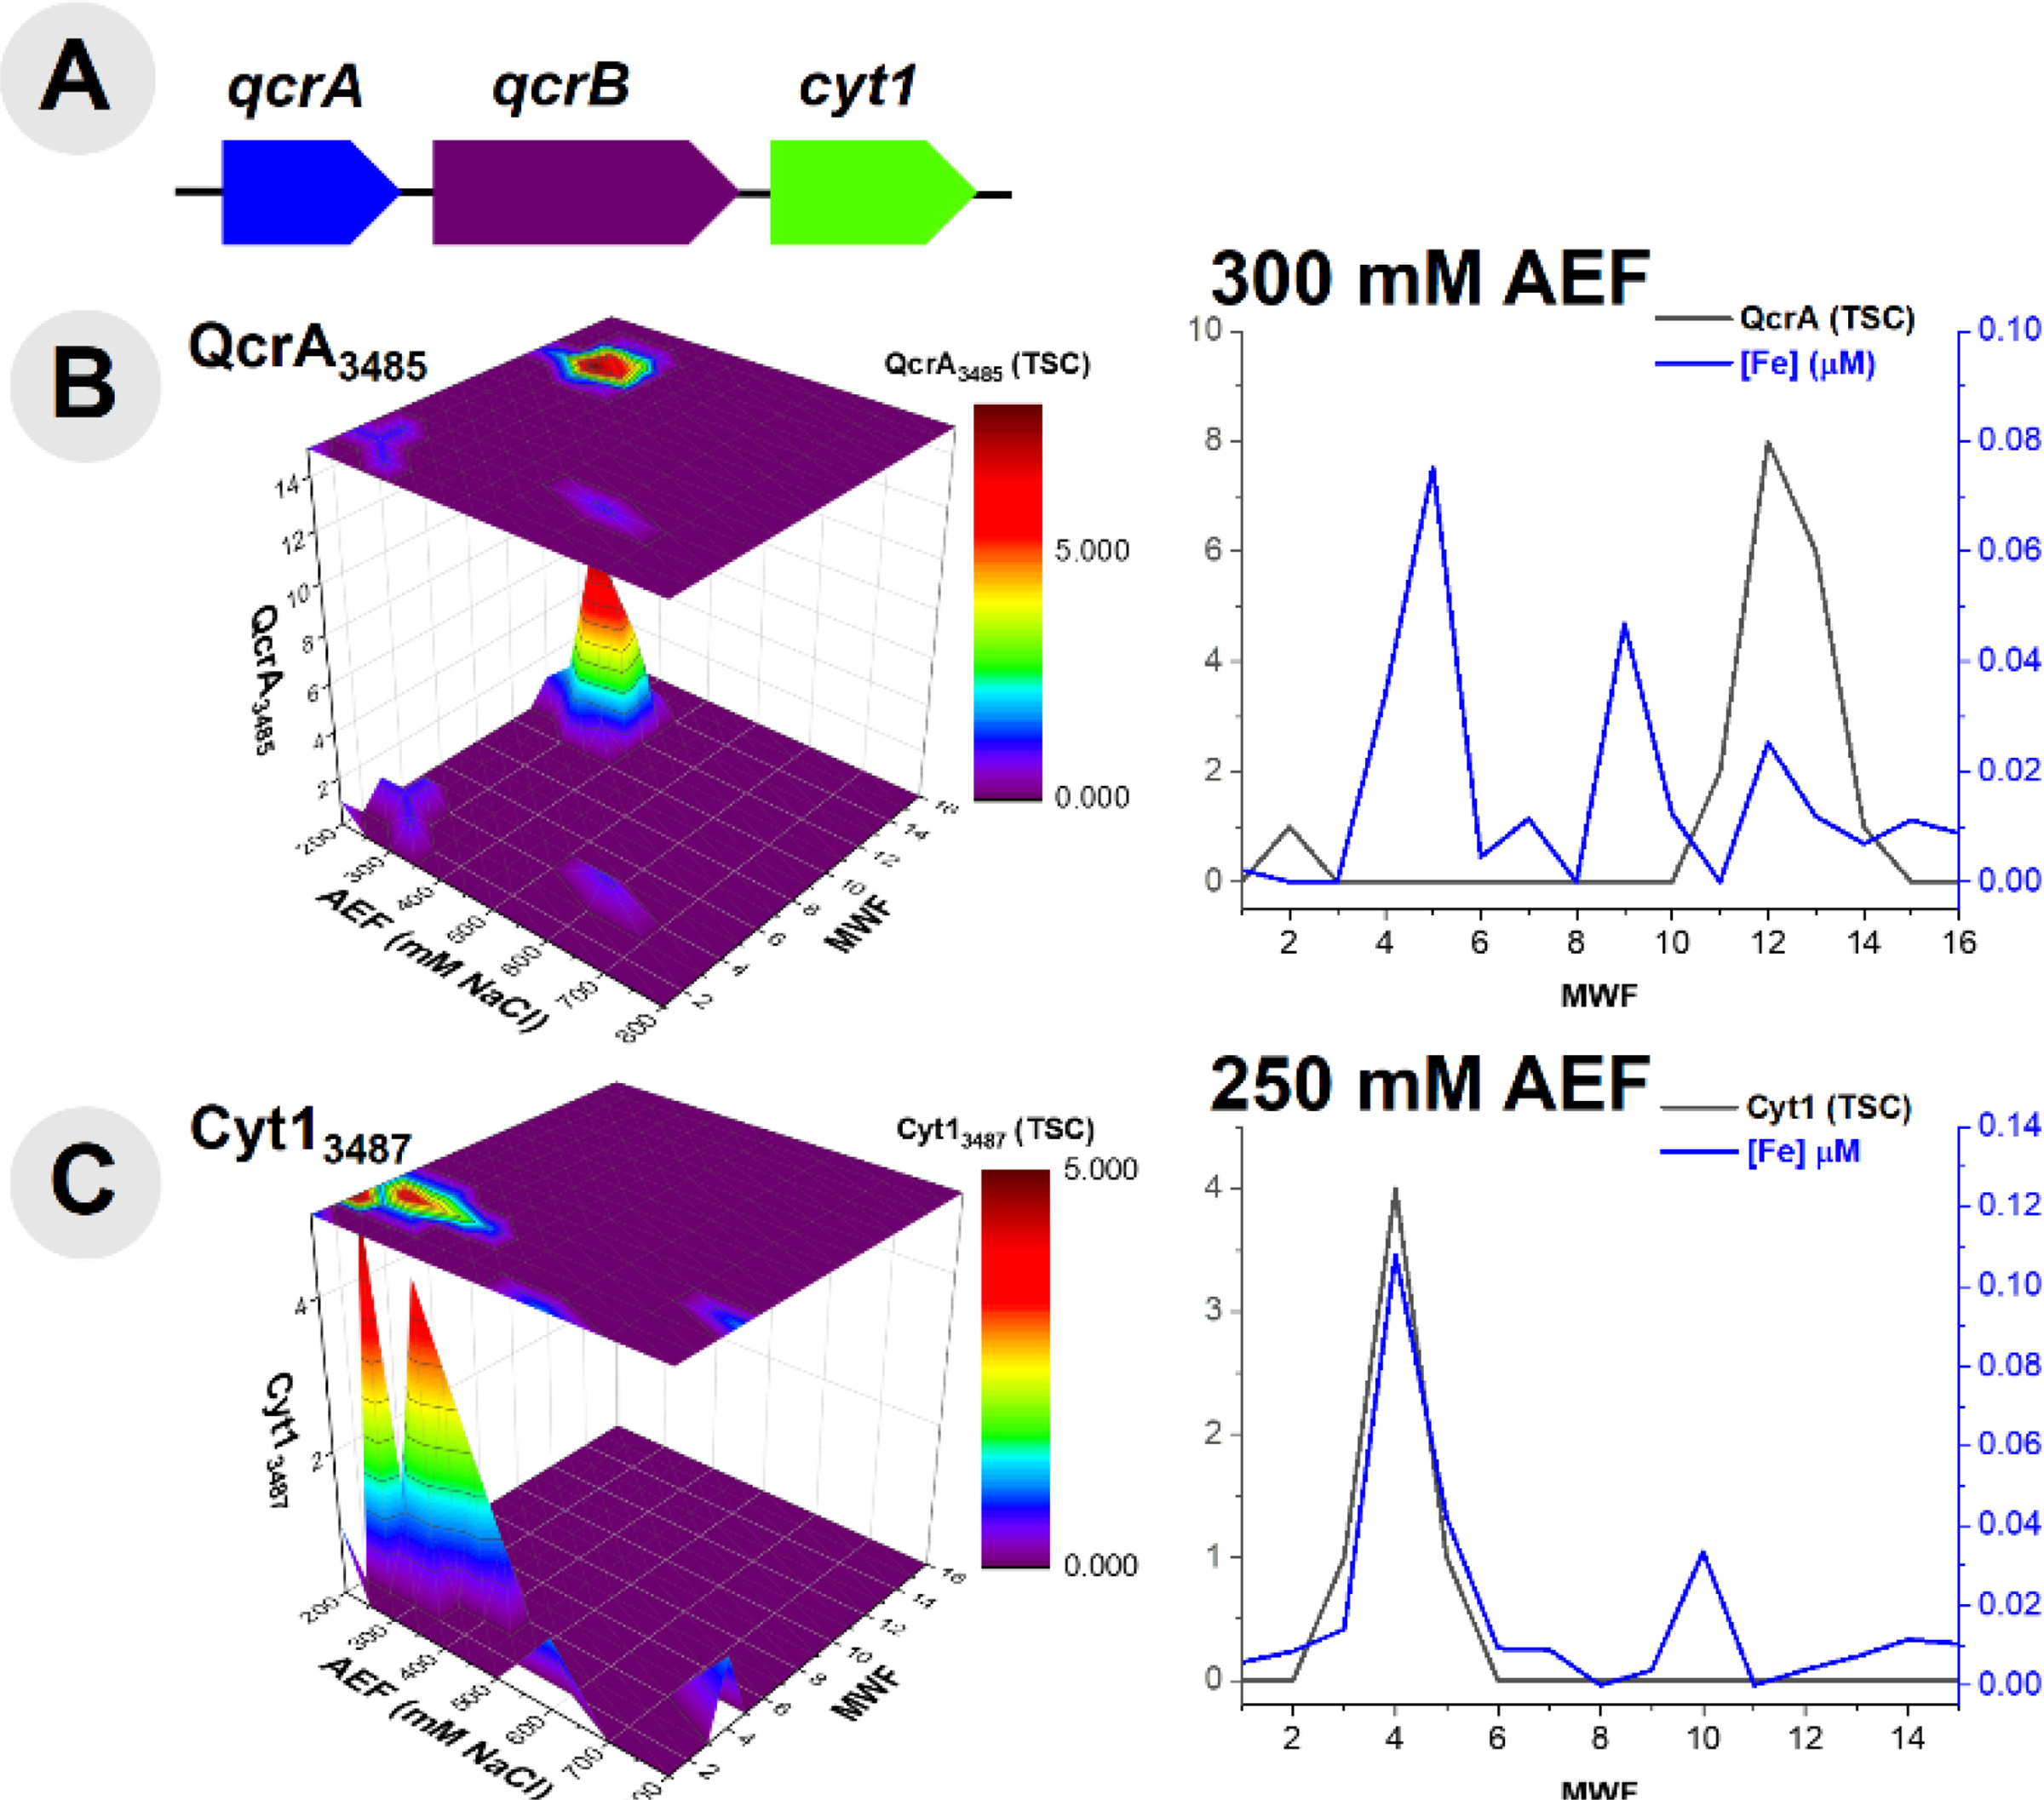
Fig 6.

(A) Gene neighborhood diagram indicating three unique cytochrome proteins and (B) comparison of the distribution of ubiquinol-cytochrome c reductase (QcrA) along the 300 mM NaCl anion exchange fraction. (C) The distribution of cytochrome c1 (Cyt1) observed within the metalloproteome and its comparison along the 250 mM NaCl anion exchange fraction.
