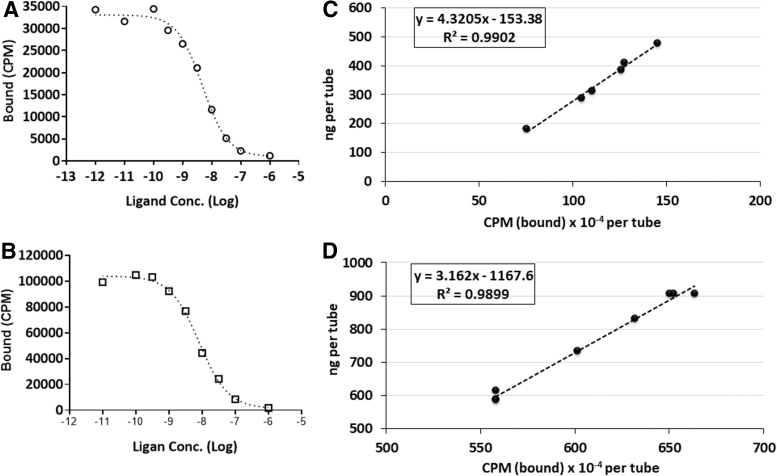
FIG. 4.
Competition binding assay and immunoreactivity plots. Representative plots from an in vitro [89Zr]Zr-3,2-HOPO-MSLN-mAb (A) and [89Zr]Zr-DFO-MSLN-mAb, (B) competition-binding assays using unlabeled MSLN targeted monoclonal antibody (self-displacement, Morris method) with HT29-MSLN cells. Each point (average of duplicates) represents cell-bound CPM. Representative plots for determination of the % immunoreactivity (immunoreactive fraction) of 89Zr]Zr-3,2-HOPO-MSLN-mAb (C) and [89Zr]Zr-DFO-MSLN-mAb (D) from the same batch by the Morris method: representative plot (linear regression curve fit), immunoreactivity for 89Zr]Zr-3,2-HOPO-MSLN-mAb = 96% and [89Zr]Zr-DFO-MSLN-mAb = 95%. CPM, count per minute.

