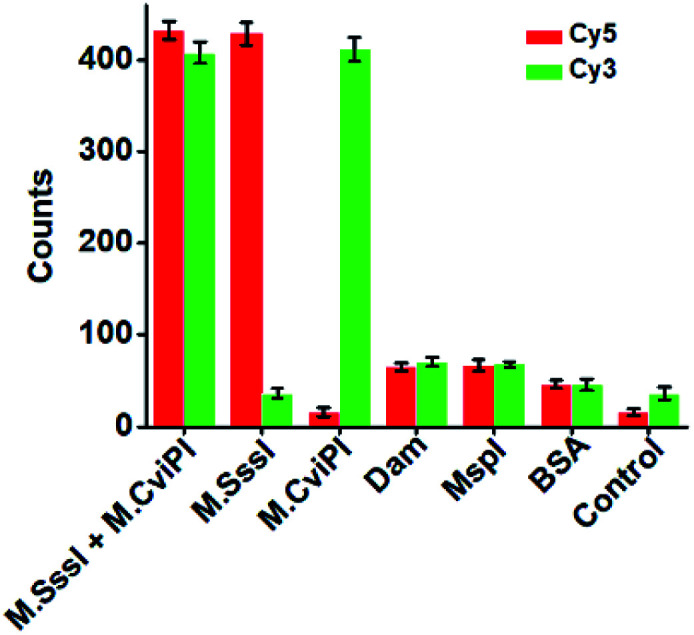
Fig. 4. Measurement of Cy5 and Cy3 counts in response to 100 U mL−1 M.SssI MTase + 500 U mL−1 M.CviPI MTase, 100 U mL−1 M.SssI MTase, 500 U mL−1 M.CviPI MTase, 100 U mL−1 Dam MTase, 100 U mL−1 MspI MTase, 0.1 g L−1 BSA, and the control with only reaction buffer, respectively. The error bars represent the standard deviations of three independent experiments.

