. 2020 Aug 19;11(34):9272–9289. doi: 10.1039/d0sc03441j

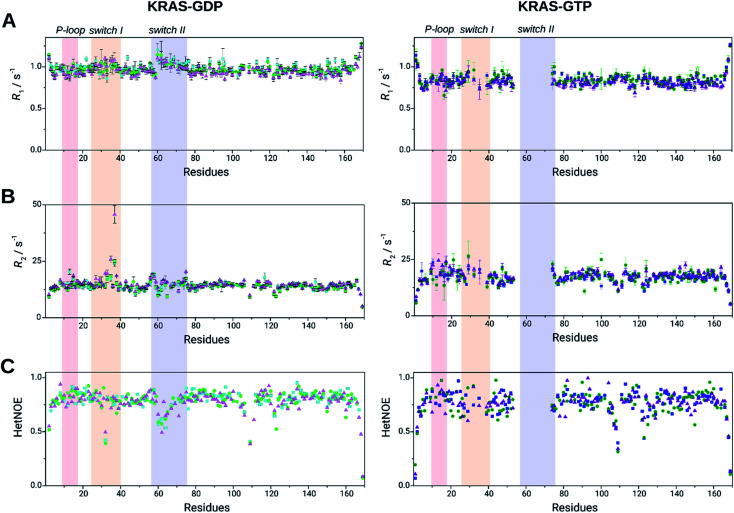
Fig. 3. Relaxation parameters of the KRAS WT (light green/green), G12C mutant (cyan/blue), and G12D mutant (lilac/purple) in GDP-bound (left) and GTP-bound forms (right). (A) R1, longitudinal relaxation rates, (B) R2, transverse relaxation rates and (C) steady-state heteronuclear 1H–15N NOE data are plotted against the residue sequence numbers. No dynamics data are reported for several residues due to their signal-broadening (in the GTP-bound forms) or signal overlapping. P-loop (light red, residues 10–17), switch I (yellow, residues 25–40) and switch II (light blue, residues 57–76) are shown in colored rectangles (R2/R1 and R2 × R1 values are shown in ESI Fig. 5, for individual values of the most interesting switch I residues see ESI Table 1).

Fig. 3