. 2020 Aug 19;11(34):9272–9289. doi: 10.1039/d0sc03441j

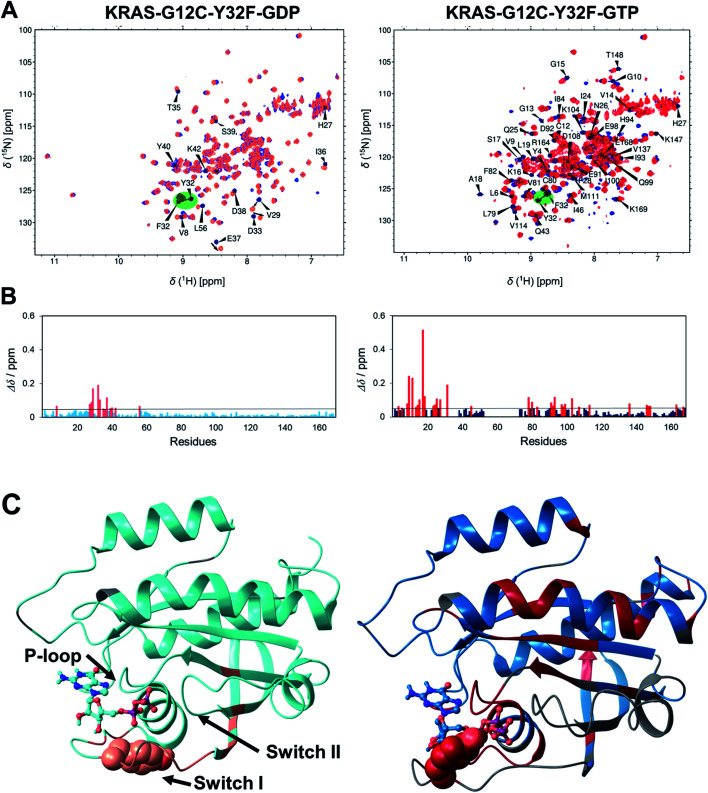
Fig. 5. (A) Overlaid 1H, 15N-HSQC spectra of KRAS-G12C-GDP (blue; left) and KRAS-G12C-Y32F-GDP (light red; left) and those of KRAS-G12C-GTP (dark blue; right) and KRAS-G12C-Y32F-GTP (red; right). Assignment is shown for the G12C mutant and only for those resonances which shifted significantly (Δδ > 0.05 ppm). The mutated Y32 → F32 is highlighted. (B) Combined chemical shift differences upon G12C/Y32F mutation along the sequence for GDP and GTP-bound forms. Δδ values are calculated according to Williamson.54 Residues for which Δδ > 0.05 ppm are colored red (GDP-bound form: left; GTP-bound form: right). (C) 3D distribution of the residues affected by the Y32F mutation (shown on the MD derived structures of the KRAS-G12C-GDP (left) and KRAS-G12C-GTP (right)): residues with significant Δδ shifts of the GDP-bound forms are colored light red (left) and those of the GTP-bound forms are colored red (right), those residues for which a signal could not be identified are shown in gray, and residues with negligible chemical shift upon mutation are colored cyan (left) and darker blue (right). The mutated Tyr32 is shown in CPK and the nucleotide is shown in ball-and-stick representation.

Fig. 5