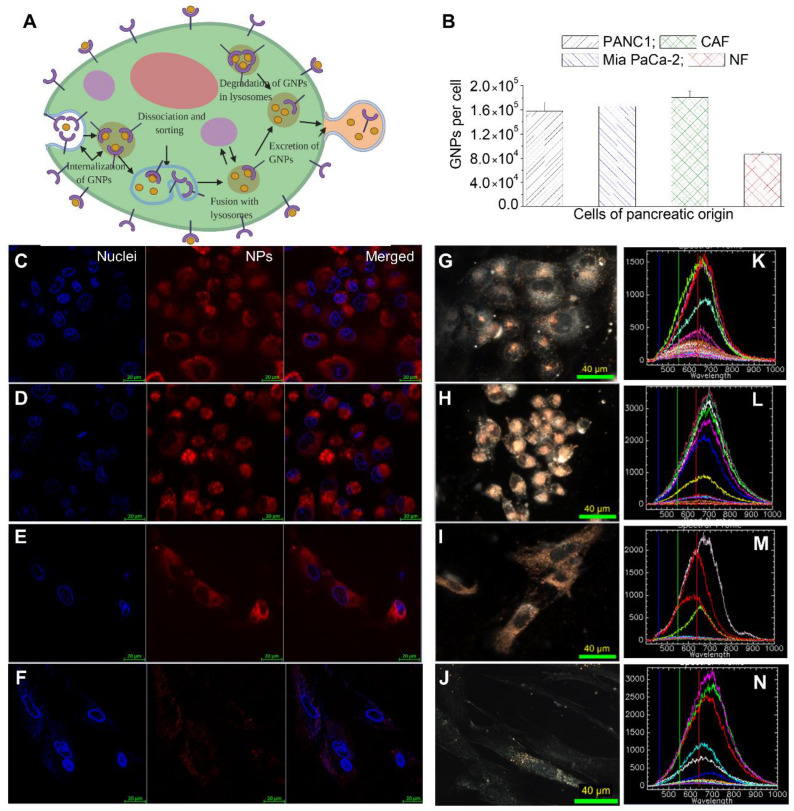
Figure 3.
Gold Nanoparticles (GNPs) uptake in cancer cells vs. normal cells. (A) A schematic diagram explains the path of GNPs within a cell. (B) Quantification of GNPs per cell in PANC-1, Mia PaCa-2, CAFs, and NFs. (C–J) Visualization of intracellular NP distribution in PANC-1 (first row), Mia PaCa-2 (second row), CAFs (third row) and NFs (fourth row) using confocal imaging (C–F) left-most panel (nucleus); middle panel (NPs); right-most panel (merged image), and dark-field (D,F) microcopy (G–J). (K–N) Hyperspectral Imaging (HSI) spectra collected from GNP clusters (bright specs) in images from G to J. Scale bars are 20 µm and 40 µm for confocal and DF, respectively.

