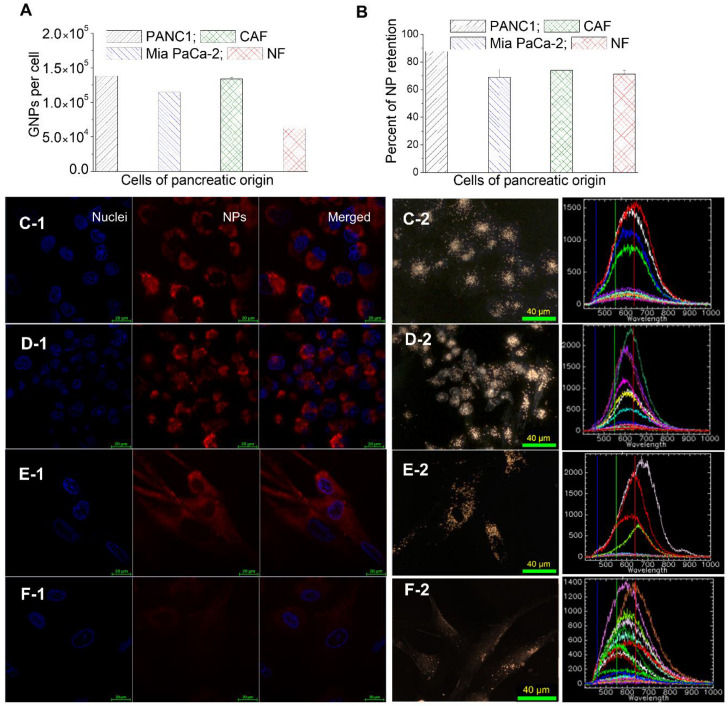
Figure 4.
Retention of GNPs in cancer cells vs normal cells. (A) GNPs retained per cell in PANC-1, Mia PaCa-2, CAFs, and NFs. (B) Percent of NP retention in PANC-1, Mia PaCa-2, CAFs, and NFs. (C–F) Confocal (leftmost panel; nucleus is stained in blue and NPs are in red), DF images (middle panel; bright specs represent GNP clusters), and HSI spectra (rightmost panel; spectra collected from bright specs as compared to background) of GNPs internalized in PANC-1 (C), Mia PaCa-2 (D), CAFs (E), and NFs (F). Scale bars are 20 μm and 40 μm for confocal and DF, respectively.

