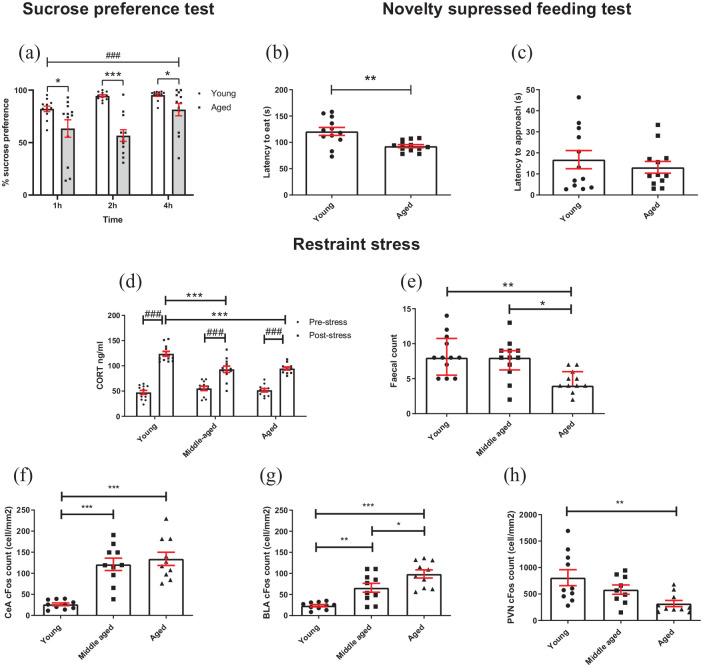
Figure 4.
Aged mice show changes in reward sensitivity and stress reactivity: (a) aged mice showed a reduced sucrose preference compared to younger mice across all time points, and preference changed across time (RM two-way ANOVA with pairwise comparisons). (b) In the NSFT, aged mice took less time to eat from the bowl than younger mice (independent t-test). (c) There was no difference in latency to approach bowl between age groups (independent t-test). (d) Following 30-min restraint stress, CORT was increased in all groups, but aged mice showed a reduced CORT response to stress compared to younger mice but not middle aged (RM two-way ANOVA with pairwise comparisons). (e) Aged mice had a lower faecal count following stress compared to young and middle-aged groups (Kruskal–Wallis test with Dunn’s post hoc (bars are median with interquartile range)). (f) Following stress, middle-aged and aged mice had a greater c-Fos count in the CeA compared to younger mice (p < 0.001, one-way ANOVA with Tukey’s post hoc analysis). (g) Aged mice had a greater BLA c-Fos count compared to middle-aged and young mice. Younger mice had a lower c-Fos count in the BLA compared to middle-aged mice (one-way ANOVA with Tukey’s post hoc analysis). (h) Younger mice had a greater c-Fos count in the PVN compared to aged mice (one-way ANOVA with Tukey’s post hoc analysis). Unless otherwise indicated bars are mean ± SEM with data points overlaid. *p < 0.05, **p < 0.01, ***p < 0.001, ###p < 0.001—refers to main effect of time or pairwise effect of stress. N = 9–12 per group.

