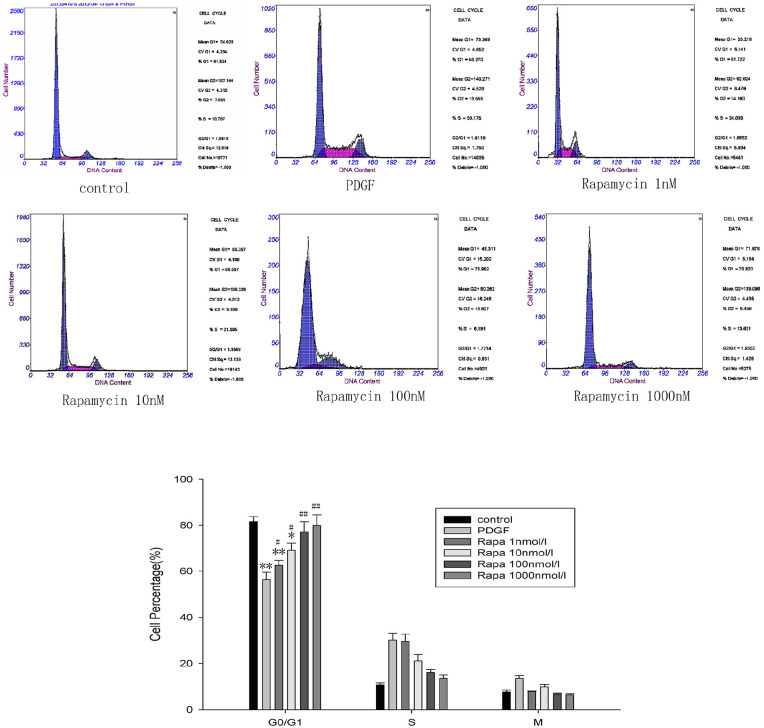
Figure 2.
Rapamycin arrested the cell cycle in the G1 phase. Flow cytometry was used to analyze the cell cycle. Rapamycin dose-dependently (1–100 nmol/L) arrested cells in the G1 phase; therefore, the number of cells in the S phase was significantly lower (n = 6/group). However, in the 1000 nmol/L rapamycin group, the proportions of cells in different stages of the cell cycle were not significantly different from those in the 100 nmol/L group.
The data are presented as the mean ± SD.
*P < 0.05. **P < 0.01 versus control.
#P < 0.05. ##P < 0.01 versus PDGF.

