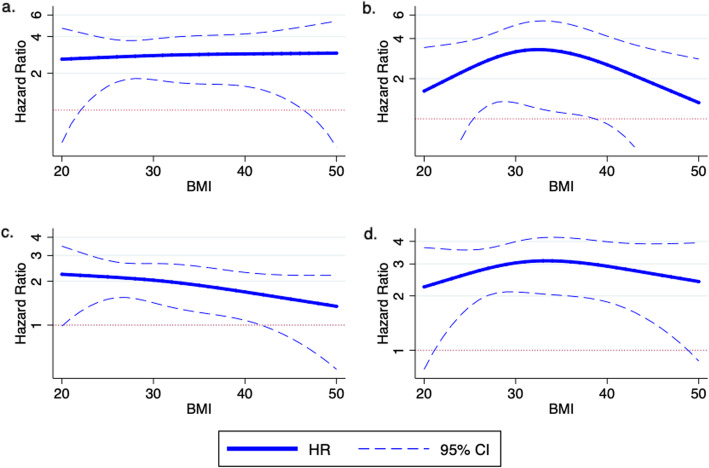
Fig. 2.
Partial effects plots of the difference in hazard ratio between AKI and no AKI across levels of BMI with a CKD incidence b CKD progression and ESRD c death and d combined CKD outcome. The plot is based on the multivariable Cox model that includes terms for AKI status, continuous BMI as a restricted cubic spline, study center, baseline CKD status, ICU status, diabetes, age, cardiovascular disease, race, gender, smoking, sepsis, chronic heart failure and the interaction between AKI status and BMI as a restricted cubic spline. Covariate values for the reference patient include age (65 years), race (white), gender (male), diabetes (no), hypertension (yes), smoker (former), CHF (no), CVD (no), ICU (no), and sepsis (no)

