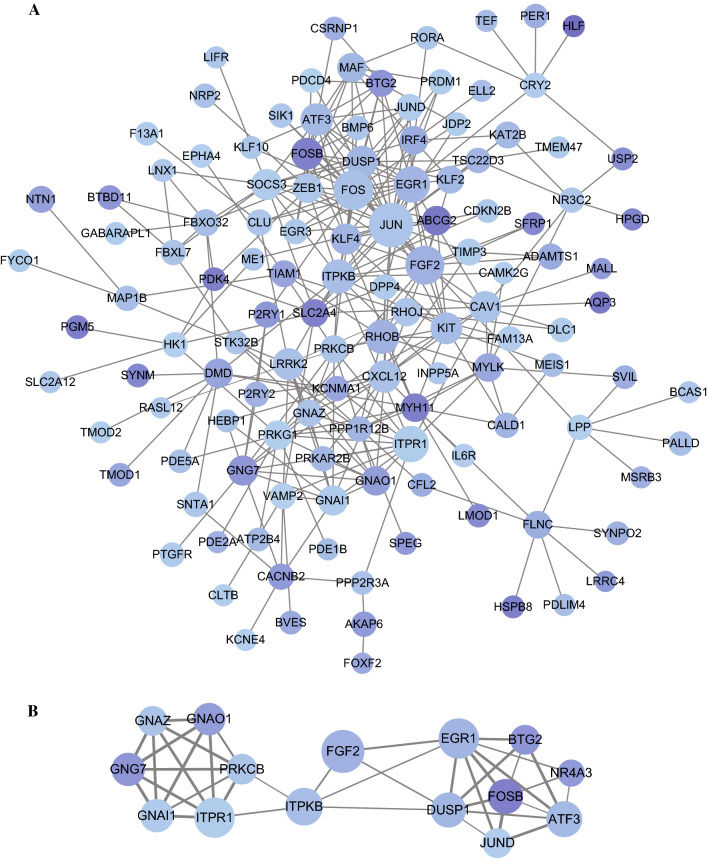
Fig. 7.
Construction of a protein–protein interaction (PPI) network with 320 target mRNAs and identification of hubgenes from the PPI network. A The PPI network with 320 target genes. B The subnetwork with 15 hubgenes that extracted from the PPI network with the “Molecular Complex Detection (MCODE)” algorithm. A, B The node color changes gradually from light blue to dark blue in ascending order according to the fold change of target genes; the thickness of line between nodes indicate the interacting proteins varies based on the combined score for the protein association

