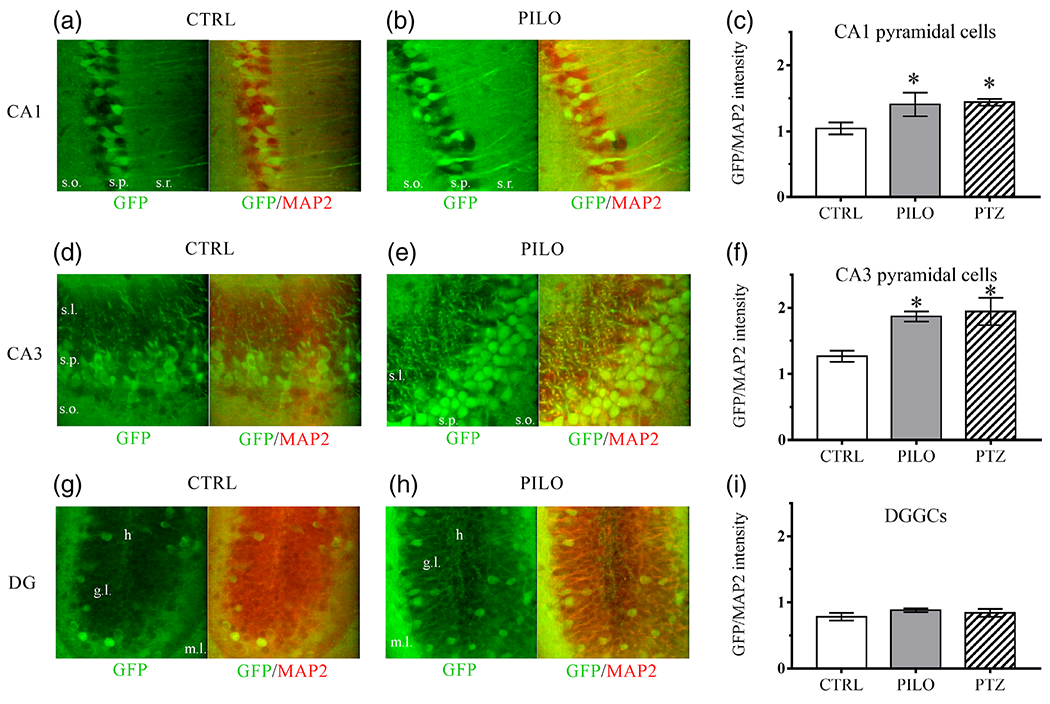
FIGURE 3.

Hippocampal cell-specific differences in KCNQ2 expression after chemoconvulsant hyperexcitability, as detected by the KCNQ2 mRNA-EGFP reporter mouse line. Representative ×40 magnification images of α-GFP or α-GFP and α-MAP2 merged immunofluorescence of hippocampal principal neurons from the three major subregions. Brain slices are from adult male mice 48 hr after vehicle-control or 230 mg/kg pilocarpine injection in adult male mice for CA1 pyramidal neurons (a-b; s.o., stratum oriens; s.p., stratum pyramidale; s.r., stratum radiatum), CA3 pyramidal neurons (d, e; s.l., stratum lucidum; s.p., stratum pyramidale; s.o., stratum oriens), and DGGCs (g, h; h, hilus; g.l, granule cell layer; m.l., molecular layer). Right-most bar graphs show quantification of normalized EGFP/MAP2 immunolabel intensity 48 hr after vehicle (CTRL), 230 mg/kg pilocarpine (PILO), or 60 mg/kg PTZ induced hyperexcitability in CA1 pyramidal neurons (c), CA3 pyramidal neurons (f), and DGGCs (i). Bar graphs are the averaged group values derived from individual cell-by-cell quantification of fluorescence intensity at ×40. n = 5-7 mice per group. Data represent mean ± SEM *p < .05 [Color figure can be viewed at wileyonlinelibrary.com]
