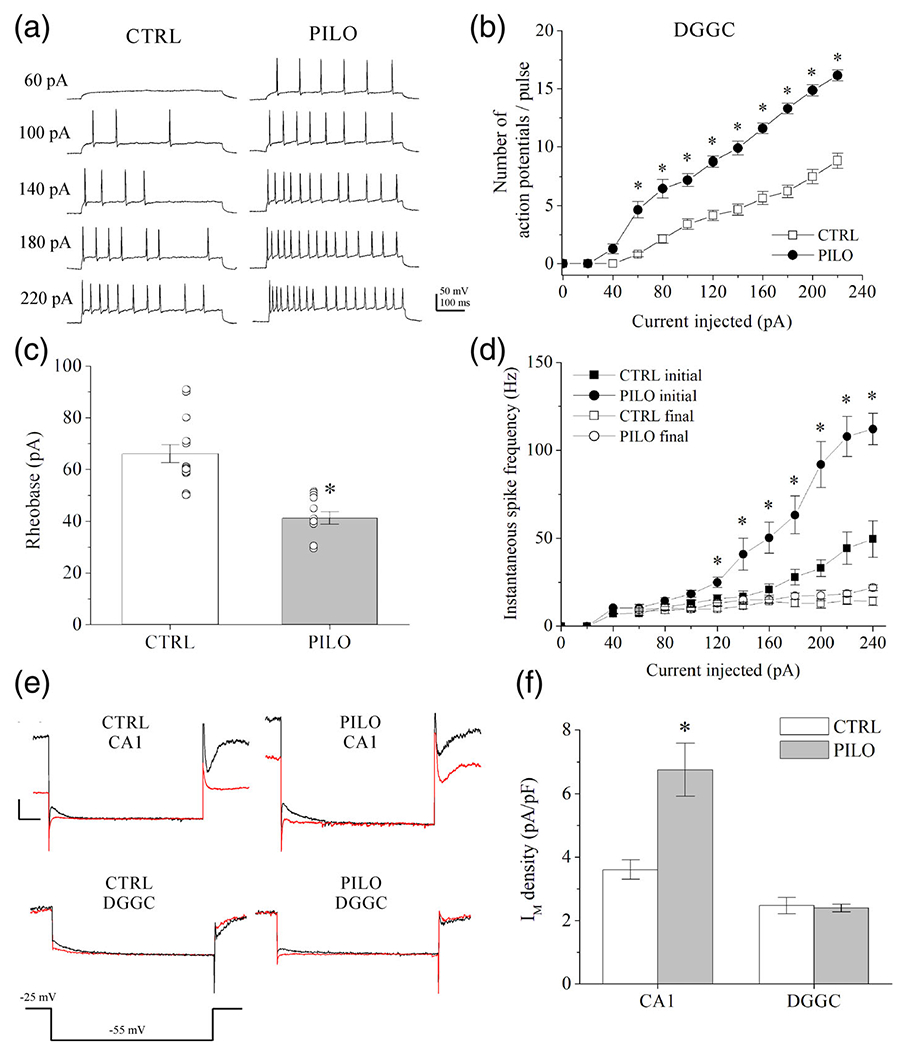
FIGURE 5.

Action potential properties and IM in DGGCs and CA1 pyramidal neurons after hyperexcitability observed using brain slice electrophysiology. (a) Shown are representative current-clamp recordings of evoked action potential firing in mouse DGGCs from brain slice, 48 hr after vehicle (CTRL) or pilocarpine (PILO, 230 mg/kg) administration. (b) Summarized action potential frequencies in DGGCs recorded in current-clamp mode as depicted in A. (c) Summarized current amplitudes required to evoke a single action potential (rheobase) in DGGCs. (d) Summarized are the initial and final instantaneous spike frequency of action potentials from DGGCs in response to increasing current injection (see Methods). (e) Shown are representative current traces of deactivating IM at −55 mV in control solution (black) or during bath-application of XE-991 (20 μM) (red) in voltage-clamp recordings of CA1 pyramidal neurons or DGGCs. (f) Bars summarize IM density (pA/pF) of CA1 pyramidal neurons or DGGCs in comparison of control and pilocarpine-injected mice, as depicted in (e). IM amplitude was measured as the current sensitive to the M-channel blocker 20 μM XE-991. Currents are normalized to cell capacitance as an index of cell membrane size. CA1 pyramidal neurons displayed significant increase to IM amplitude 48 hr after pilocarpine, whereas DGGCs demonstrated no significant changes between control and pilocarpine mice. Data represent mean ± SEM. n = 8-15 cells per group. *p < .05 versus CTRL [Color figure can be viewed at wileyonlinelibrary.com]
