. 2020 Aug 20;11(36):9863–9874. doi: 10.1039/d0sc02221g

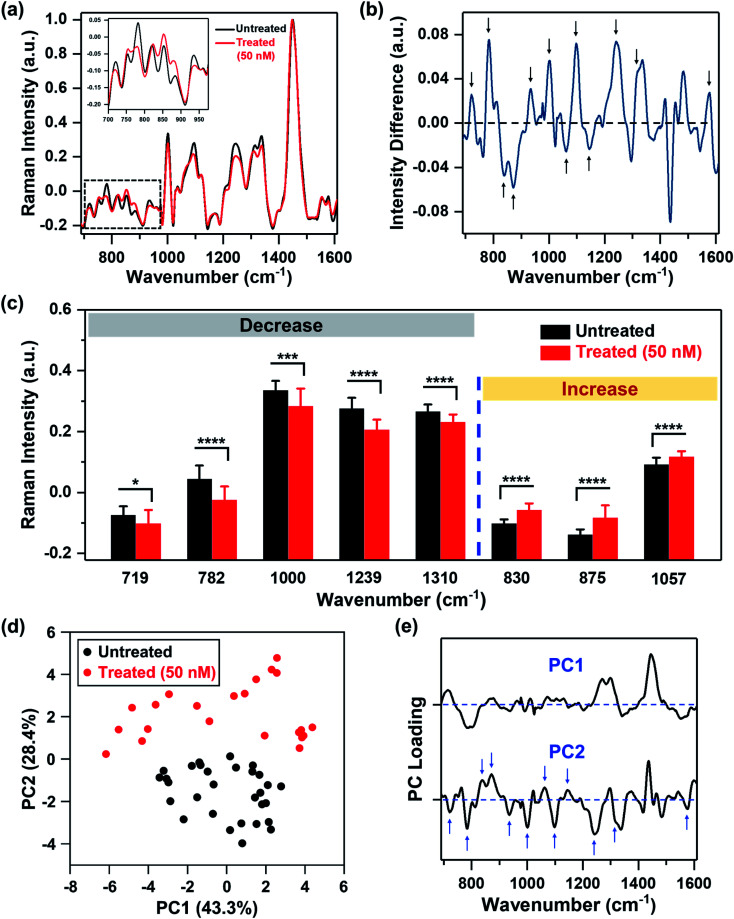
Fig. 1. MDA-MB-231 cells treated with Trametinib and probed with RS. (a) Mean normalized Raman spectra of untreated cells (black) and cells treated with Trametinib at its working concentration 50 nM (red). Spectra were normalized to 1440 cm−1 biological peak. The inset shows a magnified view of the smaller wavenumber region. (b) Difference spectrum obtained from (a) by subtracting the mean normalized Raman spectrum of cells treated with Trametinib (50 nM) from the untreated cells to highlight changes in Raman footprint. Relevant peaks that either increase or decrease with treatment are shown with an arrow. (c) Selective Raman peaks that decreased with treatment including phosphatidylcholine (719 cm−1), DNA (782 cm−1), phenylalanine (1000 cm−1), amide III (1239 cm−1) and lipids & fatty acids (1310 cm−1). Selective Raman peaks that increased after treatment including tyrosine (830 cm−1), sphingomyelin (875 cm−1), and lipids (1057 cm−1). Here, * indicates p < 0.05, *** indicates p < 0.001, and **** indicates p < 0.0001 determined by Student's t-test. (d) Principal component analysis showing clustering of untreated cells relative to those treated with Trametinib represented in a scatter plot. (e) Corresponding PC loading showing both PC1 and PC2. Relevant peaks in PC2 that distinguish the treated from untreated group are shown with arrows.

Fig. 1