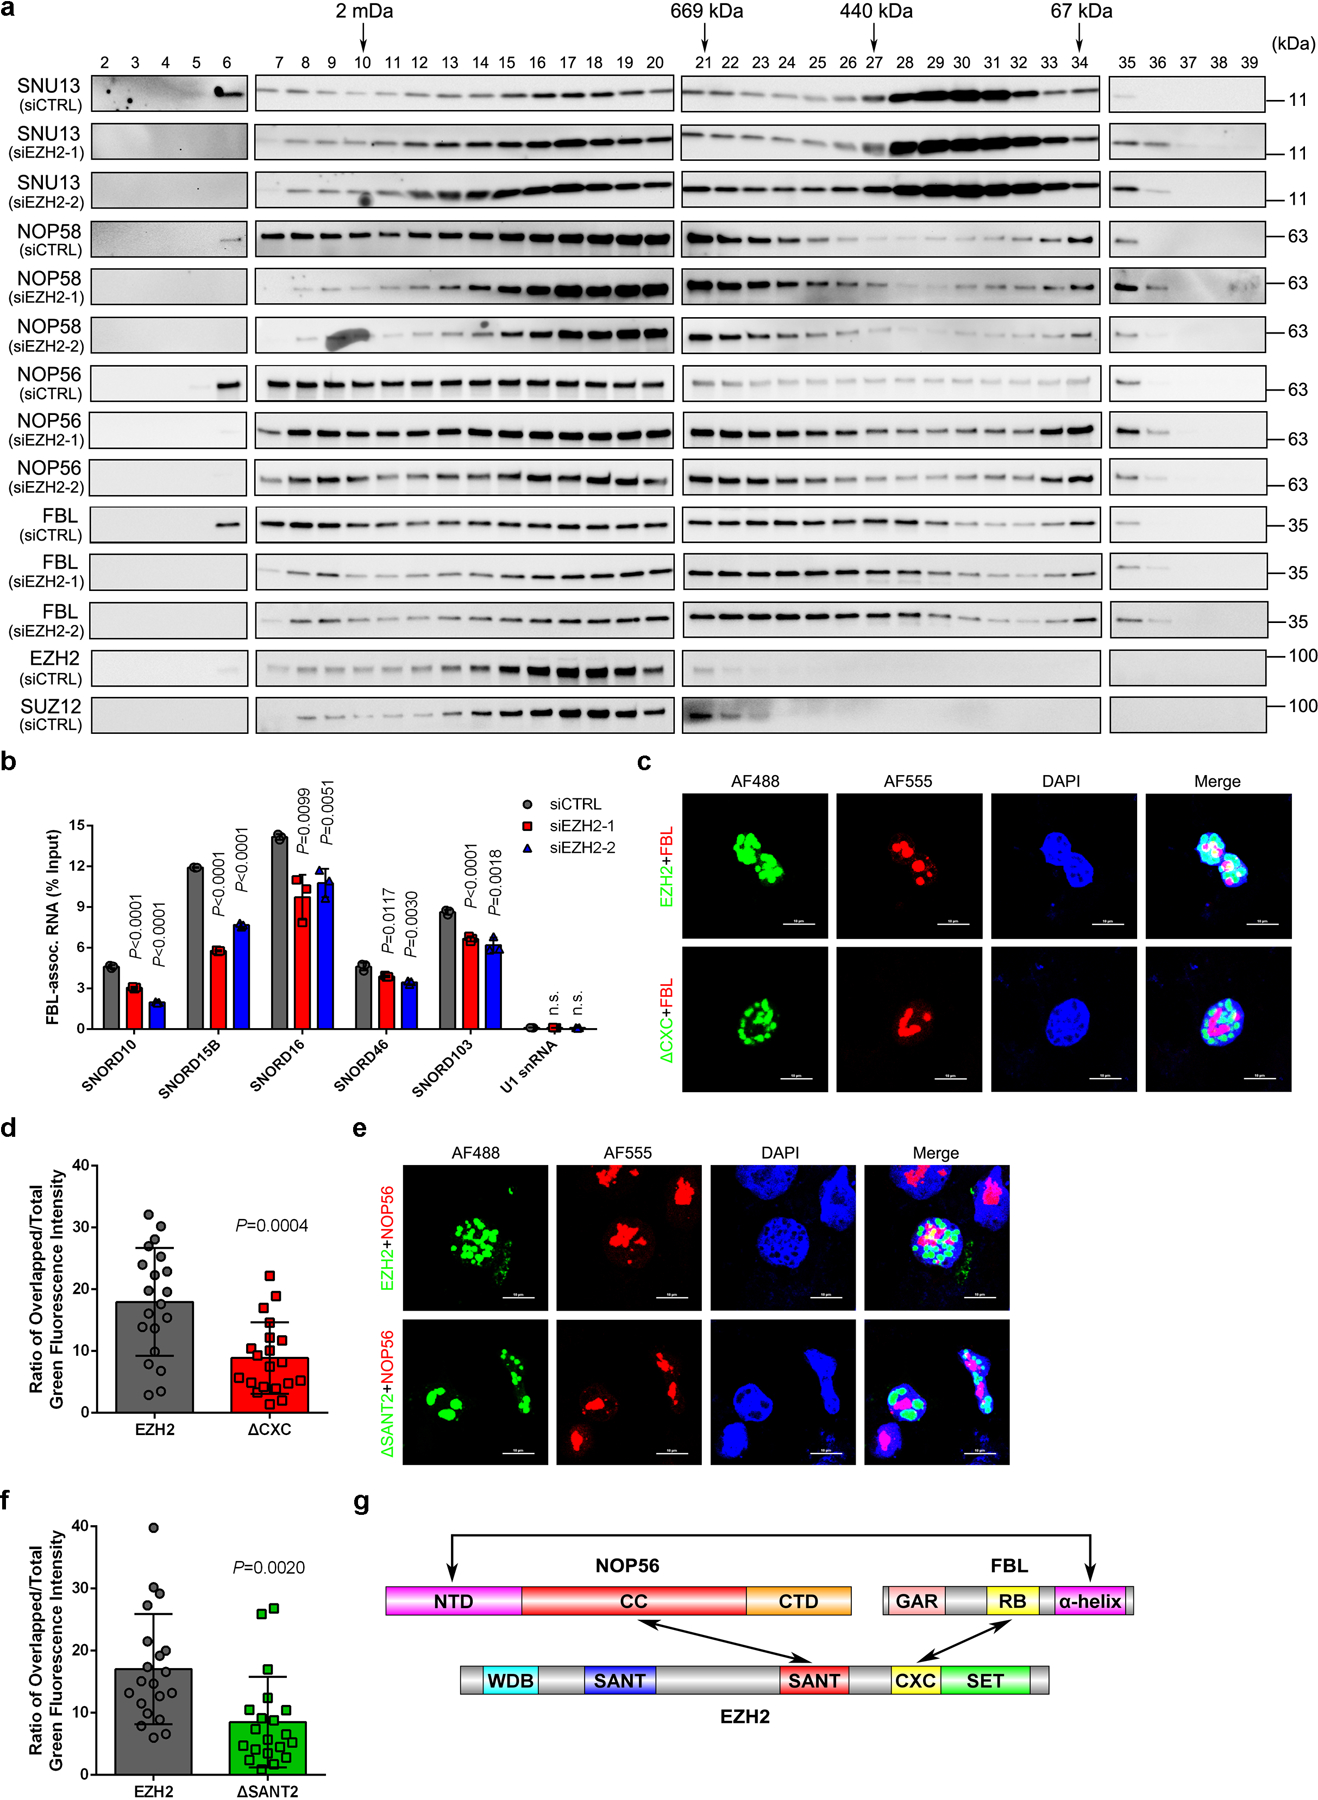
Figure 4. Formation of EZH2-FBL-NOP56 trimer facilitates box C/D snoRNP assembly.

(a) Nuclear extracts from control and EZH2-deficient C4–2 cells were subjected to size-exclusion and the protein levels of FBL, NOP56, NOP58 and SNU13 were determined by western blot analysis in all samples. Protein distributions of EZH2 and SUZ12 in control cells were also detected as references. This assay has been performed three times with similar results.
(b) RIP-qPCR assay to monitor the binding of snoRNAs to FBL in control and EZH2-deficient C4–2 cells. Data represent Mean ± SD from n=3 biologically independent experiments. U1 snRNA, which is not a binding target of FBL, was used as a control.
(c, d) Representative fluorescence images of C4–2 cells expressing GFP-EZH2 or GFP-EZH2ΔCXC. The nucleoli were co-stained using anti-FBL antibody followed by an Alexa Fluor 555-conjugated secondary antibody and the nuclei were visualized by DAPI (Scale bar: 10 μm). Graph represents the nucleolar proportion of EZH2 estimated by the ratio of nucleolar GFP intensity to nuclear GFP intensity of individual cells (Mean ± SD, n=20 cells analyzed over 3 independent experiments).
(e, f) Representative fluorescence images of C4–2 cells expressing GFP-EZH2 or GFP-EZH2ΔSANT2. The nucleoli were co-stained using anti-NOP56 antibody followed by an Alexa Fluor 555-conjugated secondary antibody and the nuclei was visualized by DAPI (Scale bar: 10 μm). Graph represents the nucleolar proportion of EZH2 estimated by the ratio of nucleolar GFP intensity to nuclear GFP intensity of individual cells (Mean ± SD, n =20 cells analyzed over 3 independent experiments).
(g) Schematic diagram of EZH2-FBL-NOP56 trimer.
For all relevant panels, unless otherwise stated, statistical significance was determined by two-tailed Student’s t-test.
Statistical source data and unprocessed blots are provided in Source data Fig. 4.
