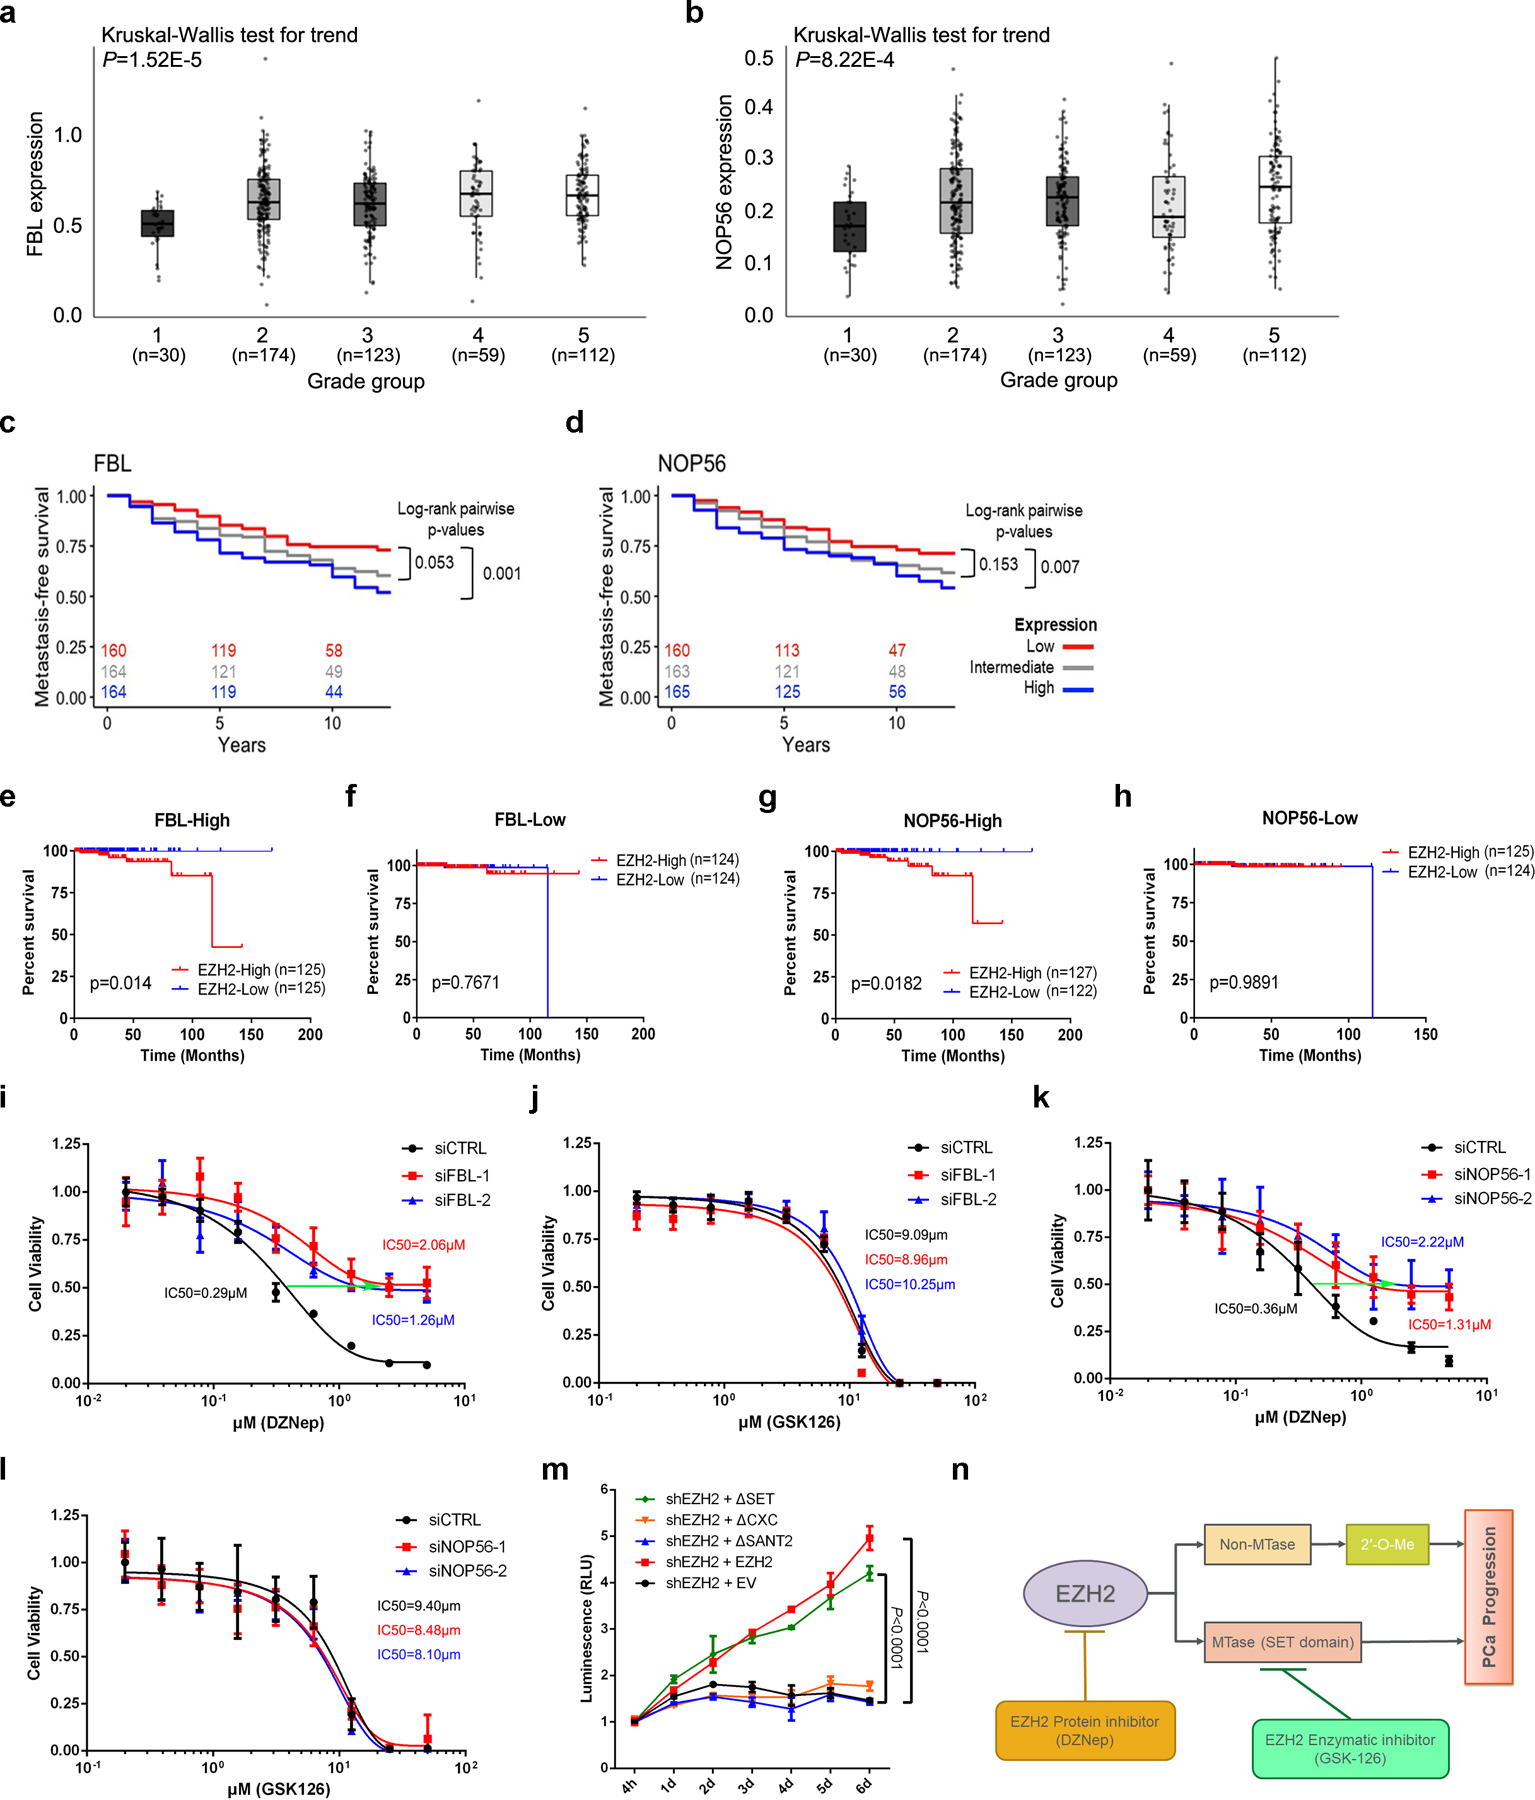
Figure 7. Contributions of FBL and NOP56 in EZH2-driven PCa tumorigenesis.

(a, b) Comparison of FBL (a) or NOP56 (b) mRNA levels in PCa patient samples with different Gleason grades using JHMI cohort. The ends of the box are the upper and lower quartiles and the box spans the interquartile range. The median is marked by a vertical line inside the box and the whiskers represent for 1.5x interquartile range. The significance of trend was calculated by two-sided Kruskal-Wallis test. ‘n’ represents the number of patients included in the analyses.
(c, d) The association between FBL (c) or NOP56 (d) expression and metastasis-free survival time of PCa patients was analyzed by Kaplan–Meier analysis using JHMI cohort. For each group, the number of patients remained at each time-point was indicated.
(e, f) The association between EZH2 expression and survival time of PCa patients with high FBL expression (e) or low FBL expression (f) was analyzed by Kaplan-Meier analysis using TCGA dataset. ‘n’ represents the number of patients included in the analyses.
(g, h) The association between EZH2 expression and survival time of PCa patients with high NOP56 expression (g) or low NOP56 expression (h) was analyzed by Kaplan-Meier analysis using TCGA dataset. ‘n’ represents the number of patients included in the analyses.
(i, j) IC50 shift assay showing the IC50 curve of EZH2 inhibitors DZNep (i) and GSK126 (j) in control or FBL-deficient C4–2 cells. Data represent Mean ± SD from n=6 biologically independent experiments.
(k, l) IC50 shift assay showing the IC50 curve of EZH2 inhibitors DZNep (k) and GSK126 (l) in control or NOP56-deficient C4–2 cells. Data represent Mean ± SD from n=6 biologically independent experiments.
(m) Cell viability assay was used to assess the proliferative capacity of EZH2-deficient C4–2 cells overexpressing full-length or truncated EZH2. Data represent Mean ± SD from n=3 biologically independent experiments. Statistical significance was determined by two-tailed Student’s t-test.
(n) Schematic diagram depicting two distinctive functions of EZH2 during cancer development. PCa, prostate cancer; MTase, methyltransferase.
Statistical source data are provided in Source data Fig. 7.
