. 2020 Jul 8;11(32):8394–8408. doi: 10.1039/d0sc02593c

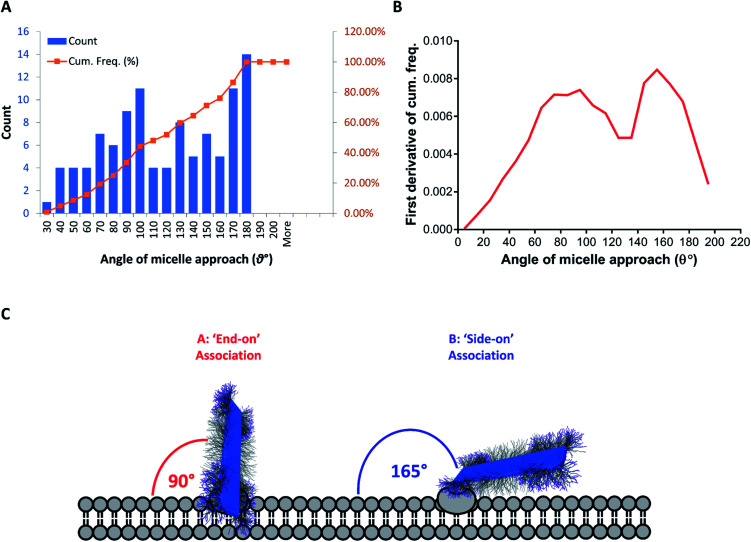
Fig. 8. (A) Histogram of the entry angle of FA–BD–PEG–BD–FA pentablock nanofibers to the cellular membrane (N = 104, blue) and cumulative frequency of observed entry angles (orange). (B) First derivative of the cumulative frequency of the observed nanofiber entry angle with cells, revealing two distributions, centered around 90° and 165° respectively. These correspond to ‘end-on’ (90°, perpendicular) and ‘side-on’ (∼180°, parallel) binding modes with the cellular membrane. (C) Schematic representation of the two major proposed association methods: ‘end-on’ (A) and ‘side-on’ (B). Transition between the two states may be possible, with ‘end-on’ nanofibers undergoing cellular internalization. Measurement of entry angle was conducted using Fiji software (ImageJ) with examples in Fig. S25..

Fig. 8