. 2020 Aug 28;11(35):9623–9629. doi: 10.1039/d0sc03922e

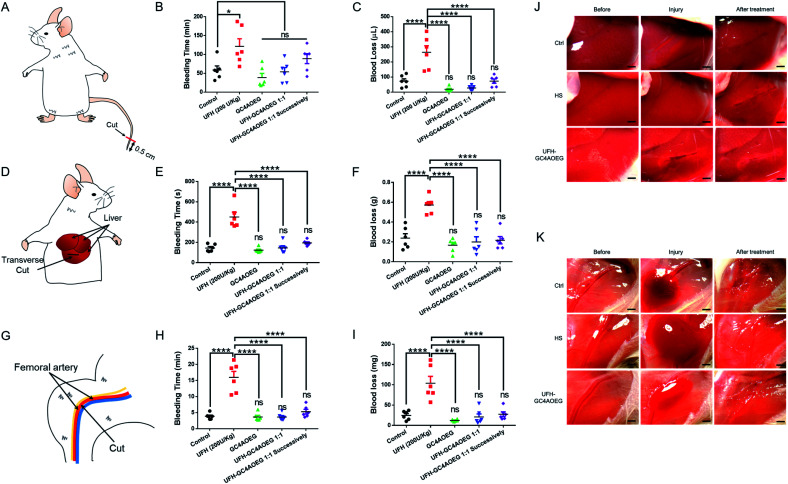
Fig. 4. Reversal efficacy in in vivo mouse models. (A–C) Mouse tail transection model. (A) Scheme of the mouse tail transection model. (B) Total time of bleeding and (C) blood loss volume. (D–F & J) Mouse liver injury model. (D) Scheme of the mouse liver injury model. (E) Total time of bleeding and (F) blood loss weight. (J) Pictures exhibiting bleeding in liver injury before and after treatment. (G–I & K) Mouse femoral artery model. (G) Scheme of the mouse femoral artery model. (H) Total time of bleeding and (I) blood loss weight. (K) Pictures exhibiting bleeding in the femoral artery before and after treatment. All of those models were i.v. administration with normal saline (control), GC4AOEG (2.245 mg kg−1), or UFH (200 U kg−1) without and with GC4AOEG (2.245 mg kg−1, 1 : 1 molar stoichiometry of GC4AOEG and the monomer unit of UFH), and UFH–GC4AOEG 1 : 1 successively (GC4AOEG at a dose of 2.245 mg kg−1 30 s after UFH administration) respectively were quantified. Data presented are the mean ± S.E.M. (n = 6). *p < 0.05, ****p < 0.001, and ns represents “no significant difference” between the experimental group and the control group.

Fig. 4