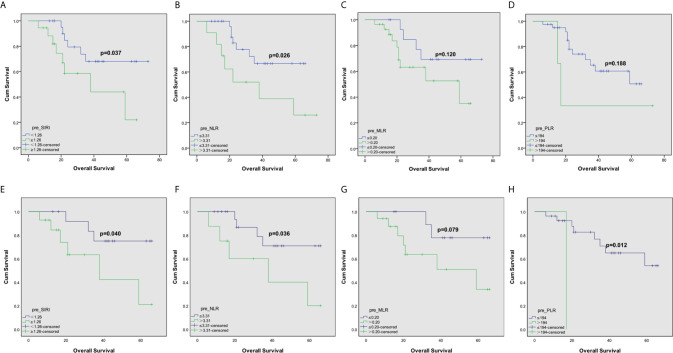
Figure 2.
Kaplan–Meier curves for patients stratified based on (A) SIRI, (B) NLR, (C) MLR and (D) PLR in operable grade III glioma patients in complete dataset. And Kaplan–Meier curves for patients stratified based on (E) SIRI, (F) NLR, (G) MLR and (H) PLR in operable grade III glioma patients after propensity matching.

