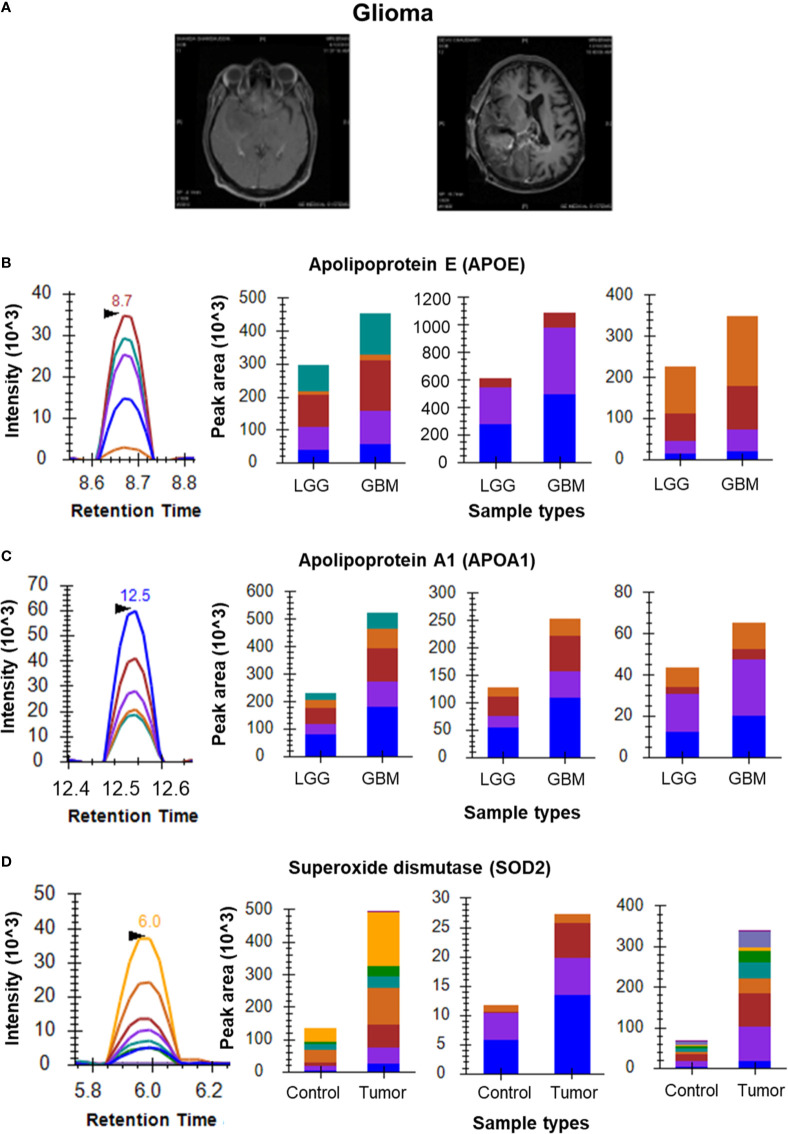
Figure 3.
MRM analysis of Glioma CSF and tissue samples. (A) T1 contrast images showing Low Grade Glioma and High Grade Glioma, respectively; (B) Representative peak shape for AATVGSLAGQPLQER and bar plots of AATVGSLAGQPLQER, LGPLVEQGR and SELEEQLTPVAEETR, respectively showing overexpression of APOE in CSF samples of GBM (n=5) as compared to LGG (n=5); (C) Representative peak shape for LLDNWDSVTSTFSK and bar plots of LLDNWDSVTSTFSK, DYVSQFEGSALGK and ATEHLSTLSEK, respectively showing overexpression of APOA1 in GBM CSF samples as compared to LGG CSF samples; (D) Representative MRM peak for one peptide of SOD2 and bar plots depicting the increased expression of peptides GDVTAQIALQPALK, LLDNWDSVTSTFSK and ATEHLSTLSEK of SOD2 in Glioma tumor tissue samples (n=6) as compared to peritumoral controls (n=3).

