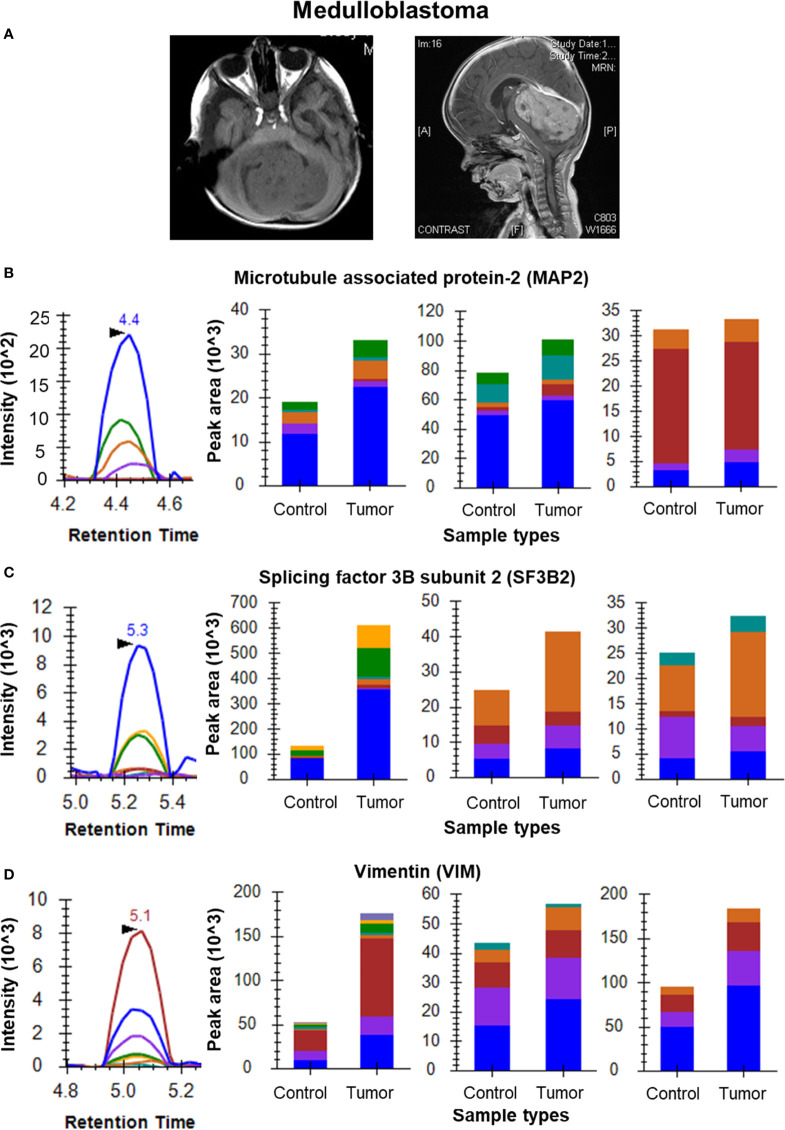
Figure 4.
MRM analysis of Medulloblastoma tissue samples. (A) MRI images of a medulloblastoma showing a mass on T1 weighted image and the sagittal contrast image showing the extent of the tumor, respectively; (B) MRM peak shape for TPGTPGTPSYPR of MAP2 and bar plots of TPGTPGTPSYPR, VGSLDNAHHVPGGGNVK and VDHGAEIITQSPGR, respectively showing overexpression of MAP2 in tumor tissue (n=6) as compared to cerebellar controls (n=3); (C) MRM peak shape for VGEPVALSEEER of SF3B2 and bar plots of VGEPVALSEEER, KPGDLSDELR and YGPPPSYPNLK, respectively showing overexpression of SF3B2 in tumor tissue as compared to cerebellar controls; (D) MRM peak shape for SLYASSPGGVYATR of VIM and bar plots of SLYASSPGGVYATR, ILLAELEQLK and FADLSEAANR, respectively showing overexpression of VIM in tumor tissue as compared to cerebellar controls.

