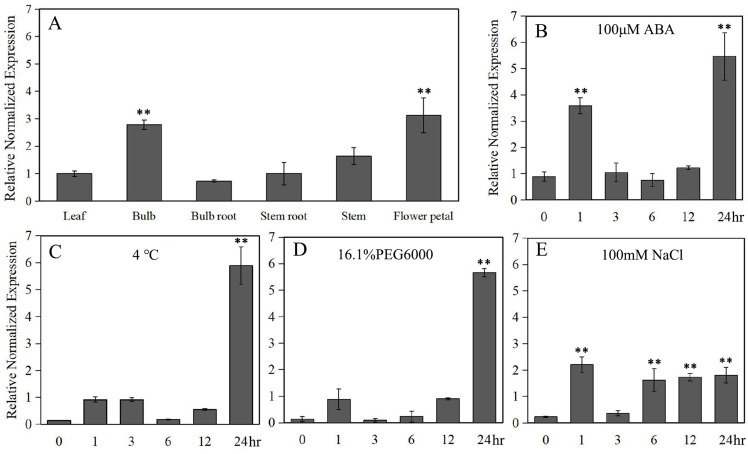
Figure 5. Quantitative real-time analysis of LlZFHD4.
The transcript level of LlZFHD4 in (A) mature leaf, bulb, bulb root, stem root, stem and flower petal under normal condition, and in leaf after (B) ABA, (C) cold, (D) drought and (E) salt treatments. Columns show relative expression levels of LlZFHD4 normalized against levels of LlTIP1 as calculated by qRT-PCR (mean ± SD of three biological replicates). Significant difference **p-value < 0.01.

