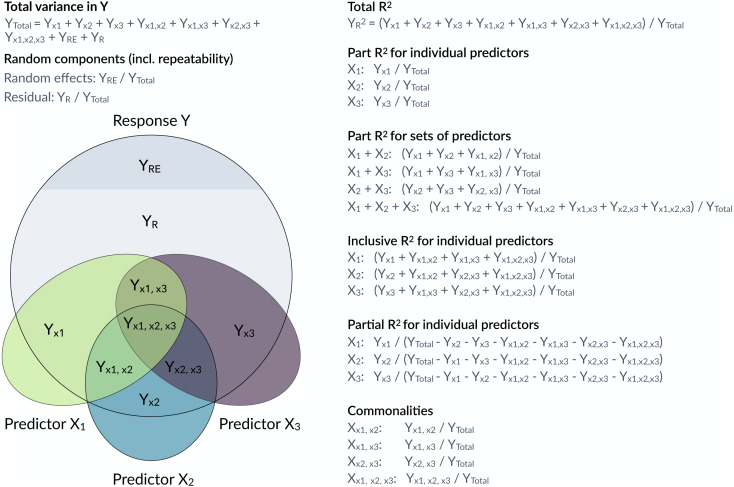
Figure 1. Conceptual framework for the estimation of proportions of variance components in a mixed model.
The large grey circle symbolizes the variance in a response Y, the dark grey area on the top indicates the share explained by random effects and the coloured ellipses symbolize variance in covariates with intersections indicating jointly explained variances. partR2 calculates total R2, part R2 for individual predictors and sets of predictors as well as inclusive R2. The package does not report partial R2 and commonalities, although they could be calculated from the partR2 output.

