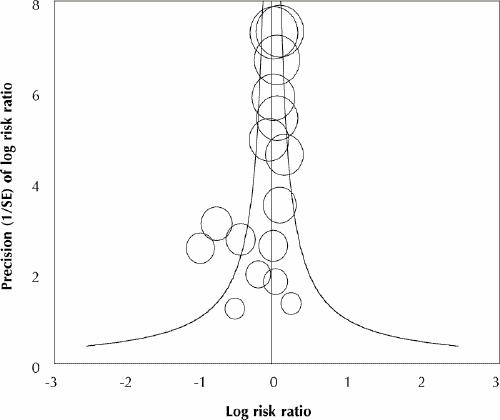
Fig. 3: Funnel plot, to assess whether there is evidence of publication bias. The standard normal deviate of the relative risk (natural logarithm of the relative risk divided by its standard error [SE]) is plotted against the estimate's precision (inverse of the SE).
