
Figure 3. Memory T cell state associations with demographic and environmental factors.
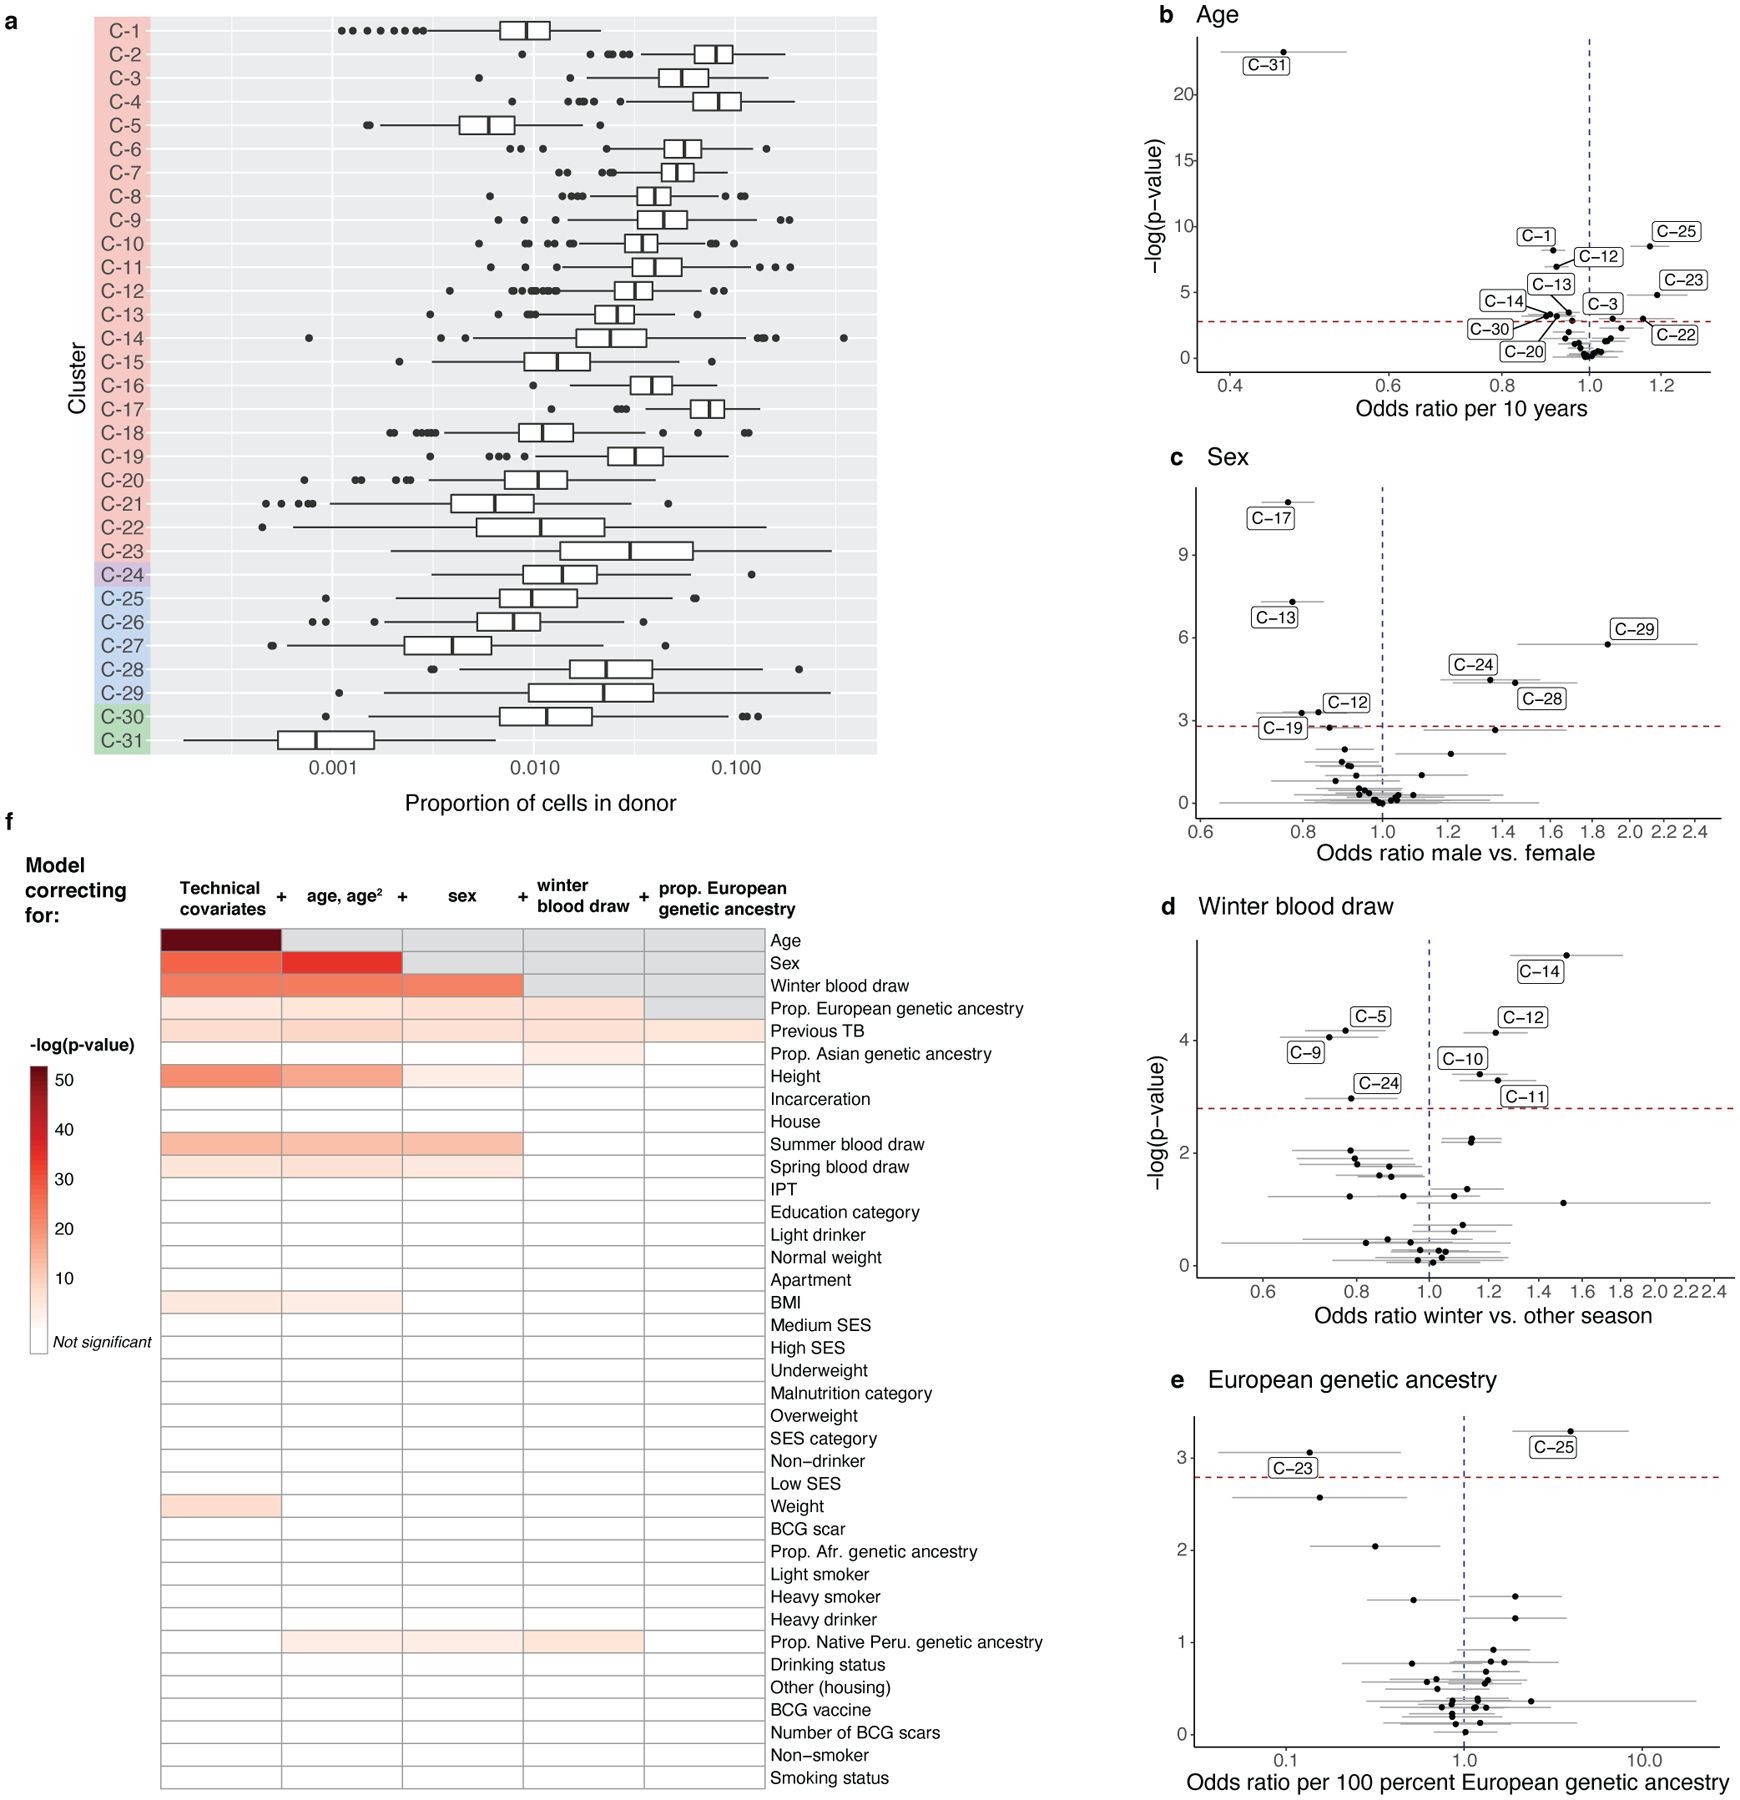
a, Distribution of cluster proportions across donors (n = 259). Boxplots show the median (vertical bar), 25th and 75th percentiles (lower and upper bounds of box, respectively), and 1.5xinterquartile range (IQR) (or minimum/maximum if they lie within that range; end of whiskers). Only non-zero proportions are plotted. b–e, Effects of age, sex, winter blood draw, and proportion of European genetic ancestry in univariate model correcting for technical covariates (# UMIs/cell, % MT UMIs/cell), donor, and batch. Error bars show the 95% confidence interval. f, Associations of covariates with T cell composition. Each column represents associations from a MASC model fit with the indicated covariate (row) as the contrast, and correcting for the indicated covariates (cumulative column headings, from left) as fixed effects and donor and batch as random effects. Heatmap colors correspond to gamma test p-values, white indicates that the covariate is not significant after multiple testing correction (p>.05/38), and gray indicates that the covariate has already been added to the model. Age and age2 are linear and quadratic terms of age at blood draw. Technical effects are # UMIs/cell and % MT UMIs/cell. IPT = isoniazid preventative therapy. BMI = body mass index. SES = socioeconomic status. BCG = Bacillus Calmette-Guérin. For all, n=271 samples from 259 independent donors.