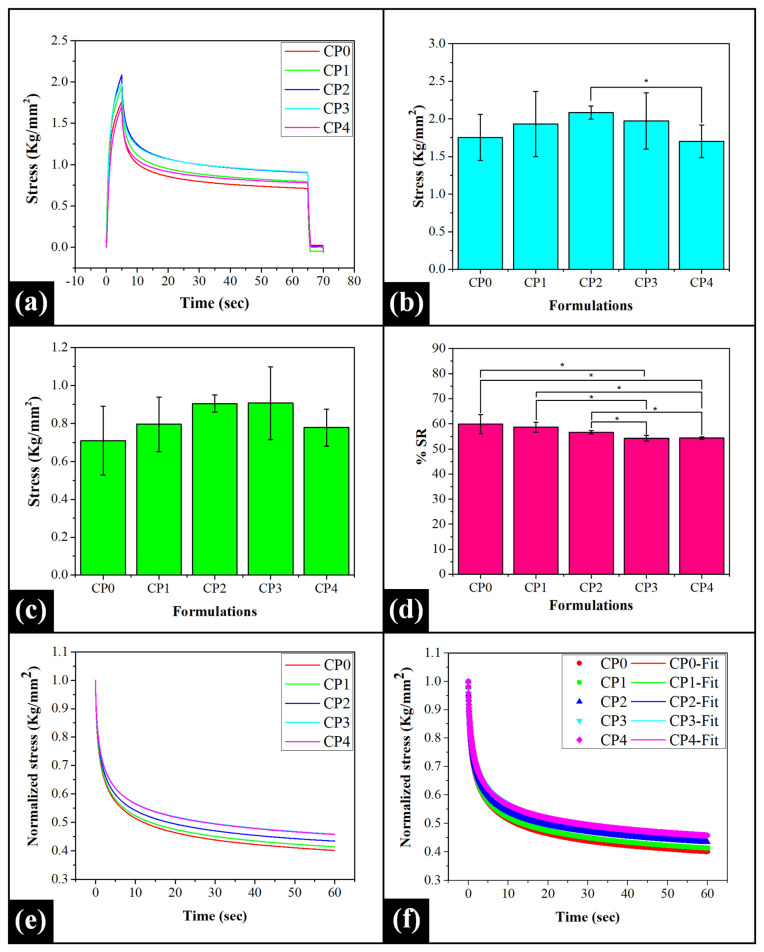
Figure 4.
Mechanical study: (a) Stress relaxation profiles; (b) σmax (mean ± standard deviation); (c) σmin (mean ± standard deviation); (d) %SR (mean ± standard deviation); (e) Normalized stress relaxation profiles, and (f) Wiechert model fitting. The symbol * denotes the significant differences at p < 0.05 level.

