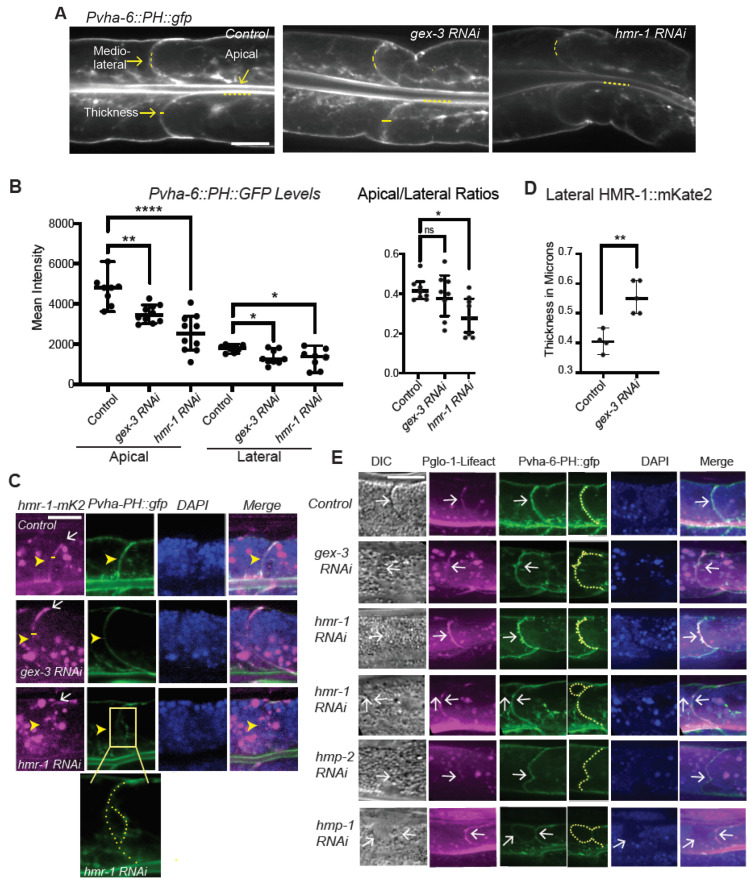
Figure 3.
Cadherin lateral morphology depends on WAVE. (A) Pvha-6::PH::GFP labels the intestinal membrane, is a biosensor for PIP2, and can show the morphology of the cells. L4 controls and animals depleted of gex-3 or hmr-1 with three days RNAi feeding were compared for enrichment at apical and lateral regions. Scale bars are 5 μm long for all panels. (B). Mean intensity of the apical (luminal) and midlateral region of the intestinal ring 3 membrane. Each data point represents one or two measurements per animal: 5 Control, 5 gex-3 RNAi and 5 hmr-1 RNAi animals. Line scans of 80 pixels (7 μm) and 35 pixels (3 μm) were used to measure the lumen and midlateral membrane signal, respectively, indicated by the dotted yellow lines in (A). (C) The lateral membrane of Int3 was compared by monitoring Cadherin (hmr-1::mKate2) and PIP2 (Pvha-6::PH::gfp) on one side of the intestine, with all images in (C) and (D) oriented so that apical is down and basal is up. White arrows point to midlateral regions. (D) The thickness of the midlateral membrane region enriched in hmr-1::mKate2 was measured, as indicated by the yellow bars in panel A and C. Each data point represents one animal: 4 Controls, 5 gex-3 RNAi animals. (E) The lateral membrane of Int3 was further compared by monitoring a strain with both intestinal F-actin (Pglo-1::Lifeact::TAG-RFP) and intestinal PIP2 (Pvha-6::PH::gfp). White arrows point to the lateral membrane and regions of altered F-actin or PIP2, including membrane distortions. * = p < 0.05, ** = p < 0.005, **** = p < 0.0005, ns = not significant.

