. 2020 Sep 21;11(41):11244–11258. doi: 10.1039/d0sc02987d

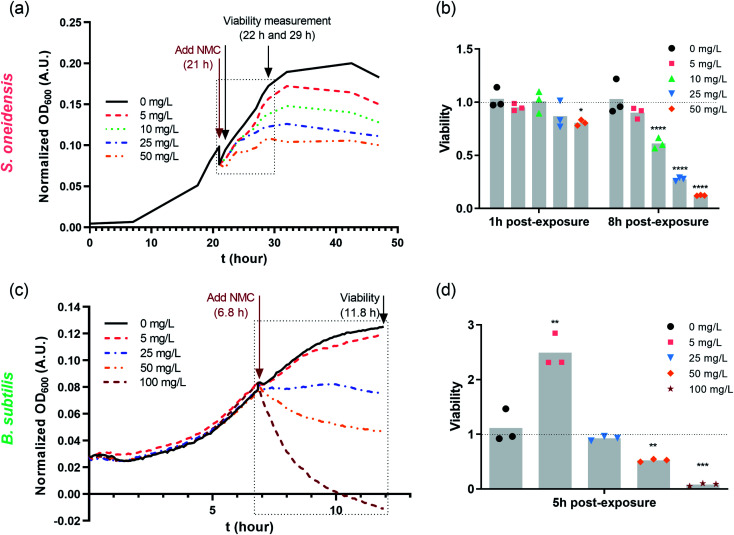
Fig. 1. Dosing NMC at mid-log phase of (a) S. oneidensis MR-1 and (c) B. subtilis growth. The time points marked with “Add NMC” indicate the time points when NMC suspension or blank media was added to make the final concentration of 0, 5, 10, 25 and 50 mg L−1 nano-NMC. (a) and (c) show the normalized average optical density over time before and after adding NMC (n = 3, error bar not shown for clarity. Plots with error bars and magnified insets can be found in Fig. S1); (b) and (d) show viability of nano-NMC-treated bacterial population compared to control (0 mg L−1) at different time points post-exposure (n = 3). Different concentrations are represented by different colors. Individual data points are shown. Asterisks denote statistically significant difference compared to control (* for p < 0.05, ** for p < 0.01, *** for p < 0.001 and **** for p < 0.0001, ANOVA followed by Dunnett's multiple comparisons test performed on log2-transformed viability).38.

Fig. 1