. 2020 Sep 18;11(38):10465–10482. doi: 10.1039/d0sc03628e

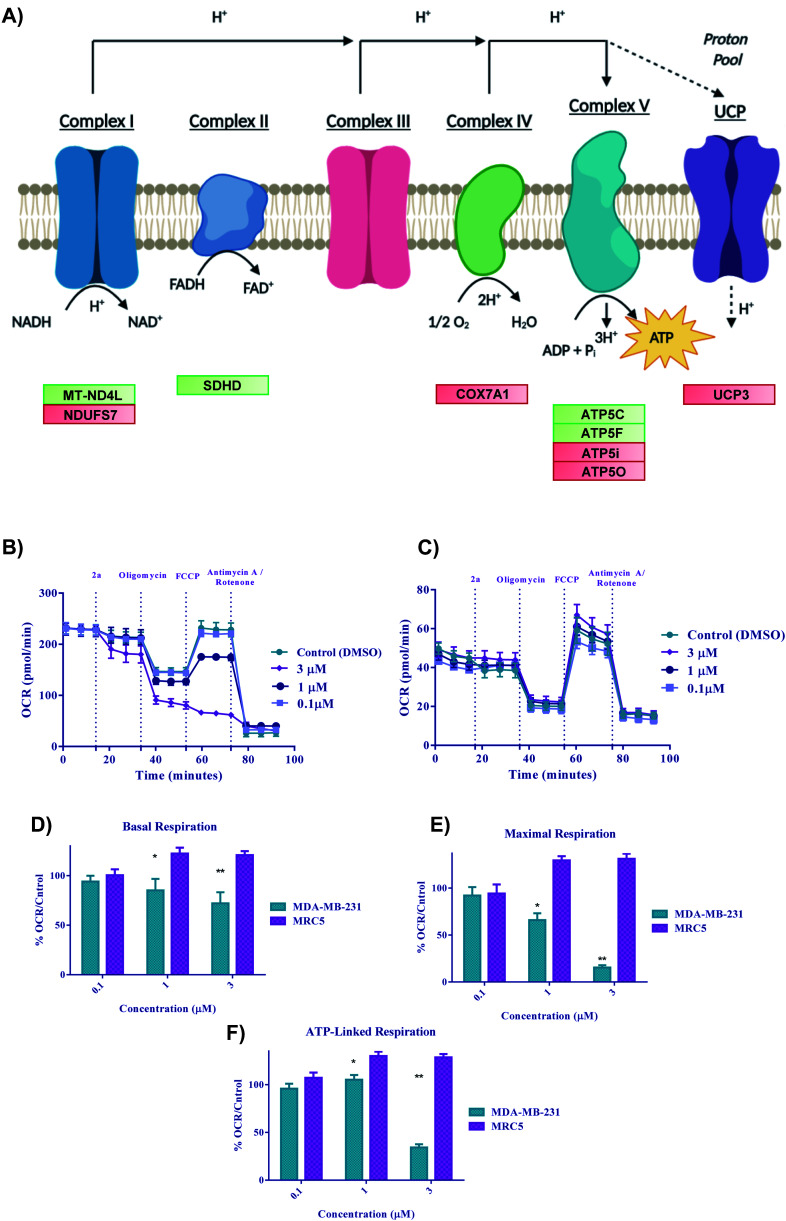
Fig. 9. Bioenergetics of 2a in cells. (A) Schematic illustration of the electron transport chain and corresponding DEGs for 2a, (B–F) Bioenergetic monitoring of MDA-MB-231 (green bars) and MRC5 (purple bars) cells following acute in vitro treatment with complex 2a. MDA-MD-231 were seeded at a density of 3 × 10⁴ and MRC5 at a density of 5 × 10⁴ and analyzed with a Seahorse XF96 analyzer to assess the effect on key bioenergetic parameters. (B and C) Mitochondria stress test was performed with pneumatic injections of compound 2a at concentrations ranging from (0.1–3 μM) and response to injections of oligomycin, FCCP, and antimycin A/rotenone. Data is plotted as the mean ± s.e.m (8 technical replicates). (D–F) Key bioenergetic parameters have significant statistical response to treatment with compound 2a at concentrations as low as 3 μM within 30 minutes in MDA-MB-231 with selectivity over MRC5 cells. Data are plotted as the mean ± s.e.m, *p < 0.05, **p < 0.01.

Fig. 9