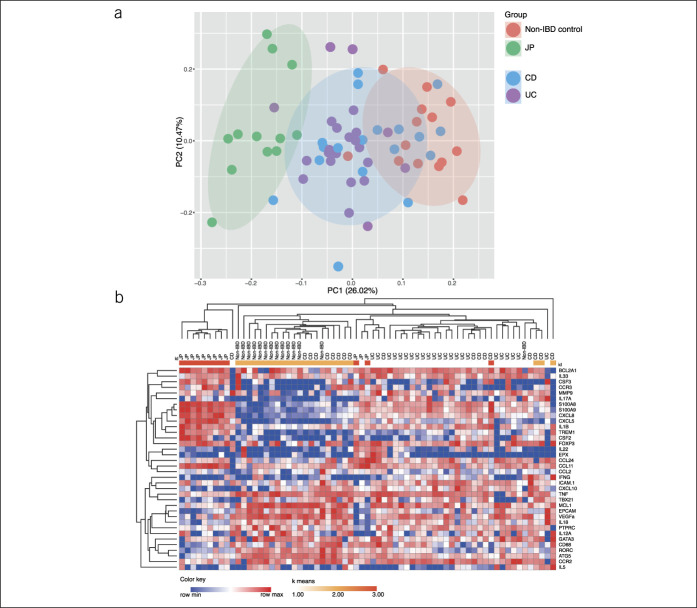
Figure 2.
(a) PC analysis of non-IBD controls vs solitary JP vs IBD, including CD and UC of the log2-transformed counts per million (CPM) of the NanoString gene expression analysis and (b) heat map of the log2-transformed CPM, including k means clustering of all genes analyzed. CD, Crohn's disease; JP, juvenile polyps; IBD, inflammatory bowel disease; UC, ulcerative colitis.

