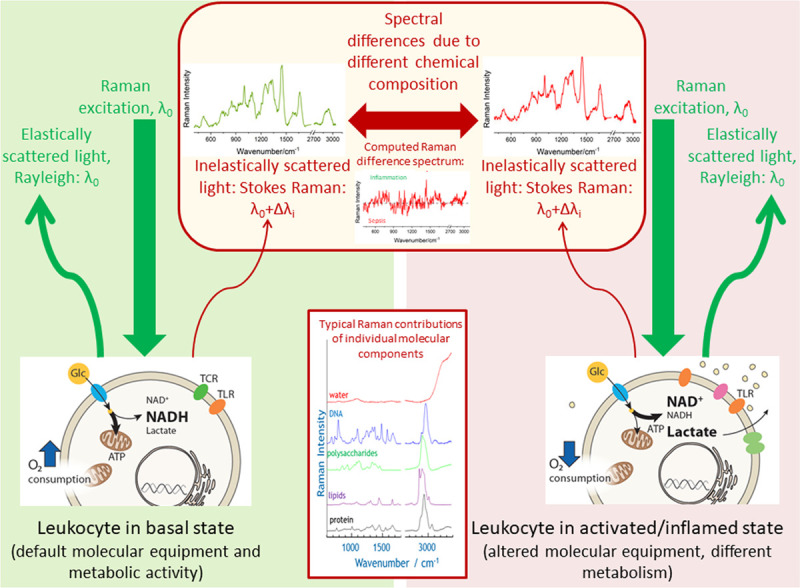
Figure 1.

Schematics visualizing the Raman effect and highlighting the molecular origin of different Raman spectra of leukocytes in different disease states. The Raman spectrum plots the wavelength shift Δλi as Raman intensity over wavenumber νi = 1/Δλi. Origin of that wavelength shift is the inelastic scattering of the monochromatic excitation light with wavelength λ0 on the different molecular vibrations of the chemical components in the leukocytes. Upon infection or exposure to pathogens, most immune cells undergo dramatic rewiring of their cellular energy metabolism which also affects immune cells’ phenotype and function (e.g., expression of different receptors [e.g., TCR = T cell receptor, TLR = toll-Like receptor). In basal state glucose (Glc) is used for efficient energy production (ATP = adenosine triphosphate) in the mitochondria. In activated state decoupling is observed with increased lactate production and increased levels of oxidized nicotinamide adenine dinucleotide (NAD+) (NADH = reduced form of NAD, H for hydrogen). As Raman spectroscopy probes intrinsic properties of the molecules (molecular vibrational states), it is a label-free method. Laser light intensities in the visible are low to keep Raman spectroscopy a nondestructive method. Spectral differences in complex biological systems, such as immune cells, are usually difficult to see by naked eye and require the use of statistical data analysis methods. The simplest way to visualize the variations between the groups is by computing a difference spectrum between the group means. In this work, also supervised statistical models are used to extract the spectral features characteristic for group differentiation as well as to assign class membership in an automated manner.
