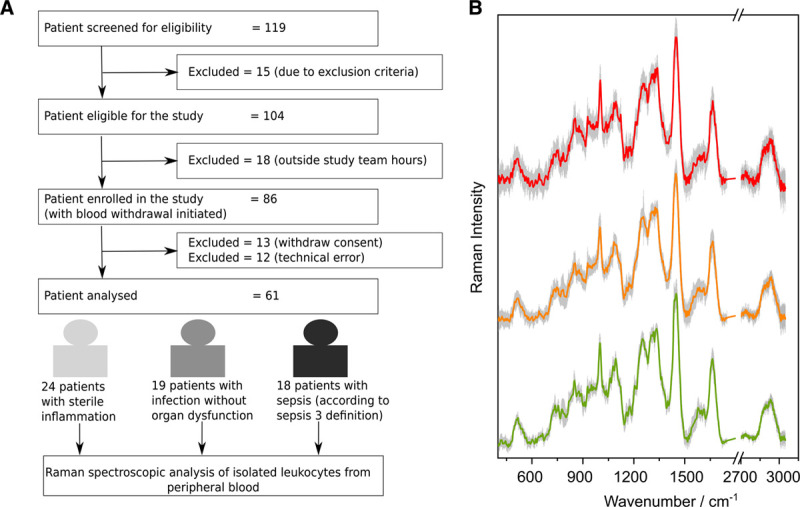
Figure 2.

Patient flow chart and Raman spectra per patient group. A, Flow chart for patient recruitment during HemoSpec study. Technical error: not possible to withdraw the required volume of blood or nonavailability of the device. B, Mean preprocessed Raman spectra are shown together with sd (gray shadows) for sepsis (red, top), infection without organ failure (orange, center), and sterile inflammation (green, bottom). The spectra are shifted on the y-axis to avoid overlap.
