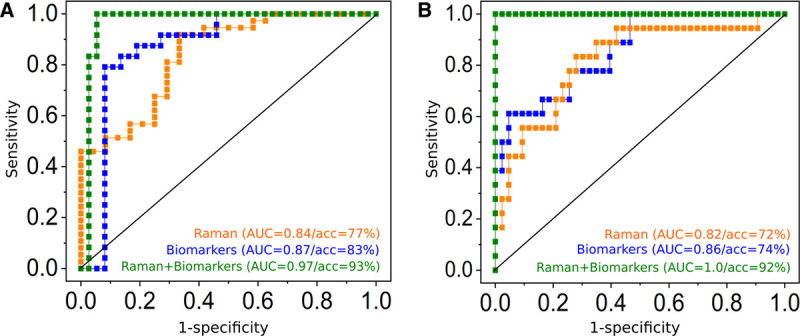
Figure 3.

Added value of Raman leukocyte analysis to detect infections (A) and to identify sepsis (B). Receiver operating characteristic (ROC) curves obtained from canonical-powered partial least squares (CPPLS) analysis. All models were validated using leave-one-patient-out cross-validation. Predictions using Raman spectroscopic data were obtained on a single-cell level and were aggregated to obtain a single value (median of all leukocytes) per patient (orange curves). A, ROC curves for infection detection (against sterile inflammation) using predictions based on Raman spectroscopic data (orange curve), biomarker scores (C-reactive protein, procalcitonin, and interleukin-6, blue curve), and on a combined model using Raman scores and biomarkers scores (green curve). B, ROC curves for sepsis detection (against sterile inflammation and infection without organ failure) using predictions from Raman spectroscopic data (orange curve), from biomarkers (blue curve) and using a combined CPPLS models using Raman scores and biomarker values (green curve). Scatterplots of the data used for sepsis detection based on Raman spectroscopic scores and biomarkers are shown in Figure S6 (http://links.lww.com/CCX/A583); the model loadings and the fitted model in Figure S7 (http://links.lww.com/CCX/A583). The combined models (green curves in A and B) show superior diagnostic power. Please note that balanced accuracies (acc) can be different from 1, also if area under the curve (AUC) is 1, as there is only a small margin between the patient groups. Thus, when a patient is excluded from the training data within the cross-validation loop, the model and the estimation of the optimal threshold change slightly. This might lead to a misprediction of some patients when the threshold is set for the prediction within the cross-validation loop, even if the cross-validated predicted values perfectly separate the groups.
