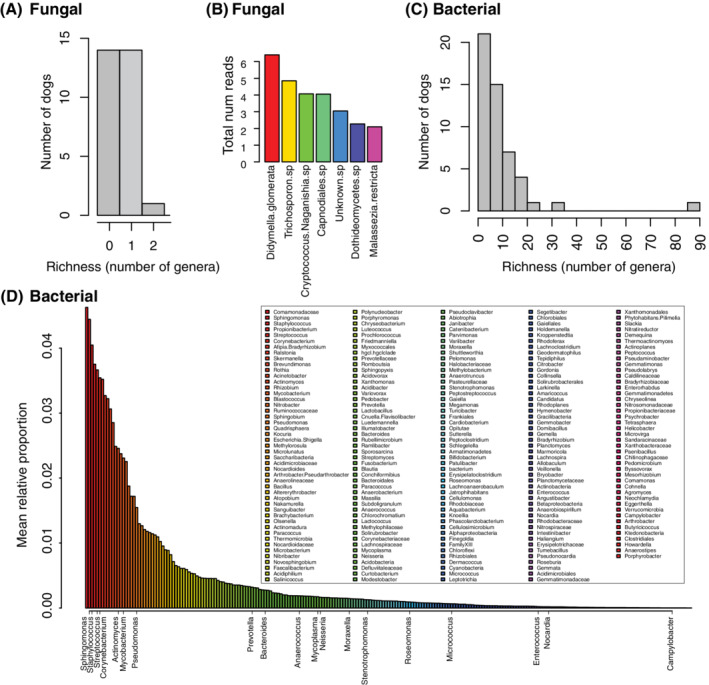
FIGURE 1.

Summary of bacterial and fungal richness and community composition. A, Histogram of the number of fungal genera encountered per dog. B, Rank abundance of fungal taxa found across all dogs expressed as the total number of reads. C, Histogram of the number of bacterial genera encountered per dog. The minimum number of bacterial genera per dog was 1 (6 dogs), the median was 7, the mean 9.6, and the maximum 87. D, Rank abundance of bacterial genera across all dogs expressed as the mean relative abundance of each genus. As described in the Section 2, bacterial genera were screened for a minimum of 10 reads (n = 231) and fungal taxa for a minimum of 2 reads per taxon (n = 7). Legend for (D) shows all bacterial genera arranged in order of relative abundance from left to right across each column. Bacterial genera shown on x‐axis of (D) represent genera in the MiDOG database encountered in previous studies of the urine microbiome considered as known or potential pathogens
