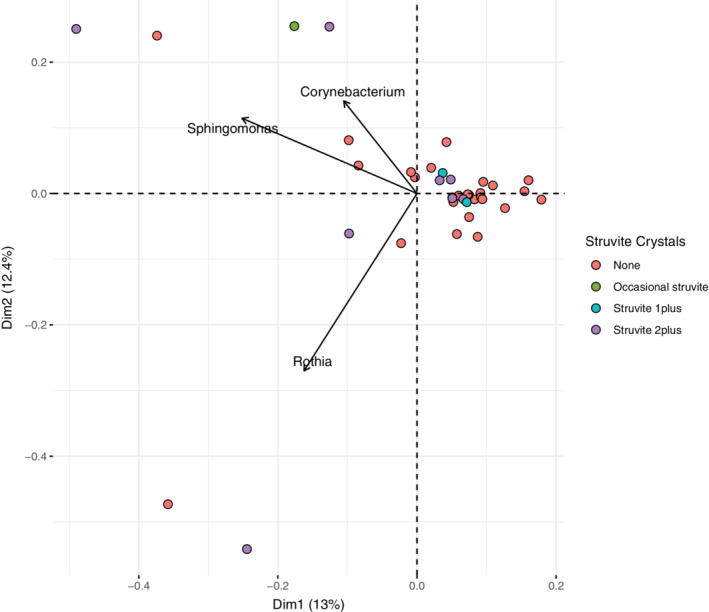
FIGURE 2.

Analysis of beta‐diversity by PCA. Because of the sparse data, the data set was reduced to dogs with at least 3 bacterial genera detected (n = 39 dogs) and genera with a minimum of 10 reads and a mean relative abundance of at least 1% (n = 25 genera). Data points are colored according to struvite crystal levels based on the significance level shown in Table 3; arrows shows the magnitude and direction of the top 3 bacterial genera contributing to the clustering of the data. PCA, principal component analysis
